Unlock a world of possibilities! Login now and discover the exclusive benefits awaiting you.
- Qlik Community
- :
- All Forums
- :
- QlikView App Dev
- :
- Bar chart help.
- Subscribe to RSS Feed
- Mark Topic as New
- Mark Topic as Read
- Float this Topic for Current User
- Bookmark
- Subscribe
- Mute
- Printer Friendly Page
- Mark as New
- Bookmark
- Subscribe
- Mute
- Subscribe to RSS Feed
- Permalink
- Report Inappropriate Content
Bar chart help.
I have the data as below Sample
ID Lend Borrow Spend
1 Yes No Yes
2 No Yes No
3 No Yes Yes
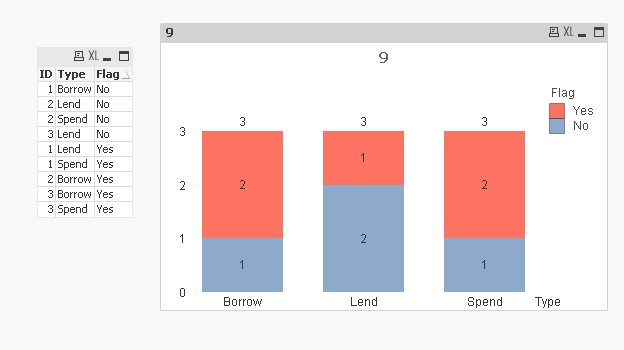
I need to create a stacked bar chart where each bar will represent the type of Expense and it will show the count of Yes and no in the stacked bar.
How can I do this ?
Thanks much.
Accepted Solutions
- Mark as New
- Bookmark
- Subscribe
- Mute
- Subscribe to RSS Feed
- Permalink
- Report Inappropriate Content
Try CrossTable load:
Table:
CrossTable(Type, Flag)
LOAD * Inline [
ID, Lend, Borrow, Spend
1, Yes, No, Yes
2, No, Yes, No
3, No, Yes, Yes
];
- Mark as New
- Bookmark
- Subscribe
- Mute
- Subscribe to RSS Feed
- Permalink
- Report Inappropriate Content
Hi AnsH
Maybe you can use "count" at the expression definition (=count(Lend).
Good Luck
- Mark as New
- Bookmark
- Subscribe
- Mute
- Subscribe to RSS Feed
- Permalink
- Report Inappropriate Content
Try CrossTable load:
Table:
CrossTable(Type, Flag)
LOAD * Inline [
ID, Lend, Borrow, Spend
1, Yes, No, Yes
2, No, Yes, No
3, No, Yes, Yes
];
- Mark as New
- Bookmark
- Subscribe
- Mute
- Subscribe to RSS Feed
- Permalink
- Report Inappropriate Content
Awesome Sunny. Thank you very much. Appreciate your time and help.