Unlock a world of possibilities! Login now and discover the exclusive benefits awaiting you.
- Qlik Community
- :
- All Forums
- :
- QlikView App Dev
- :
- Bar chart help
- Subscribe to RSS Feed
- Mark Topic as New
- Mark Topic as Read
- Float this Topic for Current User
- Bookmark
- Subscribe
- Mute
- Printer Friendly Page
- Mark as New
- Bookmark
- Subscribe
- Mute
- Subscribe to RSS Feed
- Permalink
- Report Inappropriate Content
Bar chart help
Hello community,
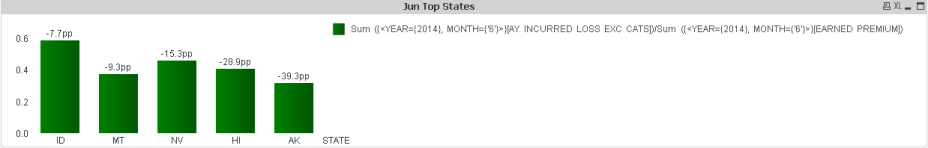
Looking for some help on a bar graph that I am having difficulty doing the formula for. Here is what I am looking to produce:
I am looking to graph ratios by state which I am able to do. I am also looking to sort the graph by a different expression which I have also done. I am having difficulty getting the formula correct and looking for an idea. Here is what I need:
The formula should involve the variance in ratio for 2014 from plan, while also taking into account the weight of the state. IE a variance in a bigger state is a big deal. I cannot figure out how to represent the relative nature of the state. Here is my formula so far:
((Sum ({<YEAR={2014}, MONTH={'6'}>}[Losses])/Sum ({<YEAR={2014}, MONTH={'6'}>}[EARNED PREMIUM])-
Sum ({<YEAR={'PLAN'}, MONTH={'6'}>}[Losses])/Sum ({<YEAR={'PLAN'}, MONTH={'6'}>}[EARNED PREMIUM])) * weight of state
I thought of doing (sum of loss / sum of earned premium) / (count of loss / count of earned premium) = weight of state. That did not seem to work.
Looking for some help on this. Here is a copy of the graph:
- Mark as New
- Bookmark
- Subscribe
- Mute
- Subscribe to RSS Feed
- Permalink
- Report Inappropriate Content
In denominator, you need to use COUNT or SUM as per your given definition?
- Mark as New
- Bookmark
- Subscribe
- Mute
- Subscribe to RSS Feed
- Permalink
- Report Inappropriate Content
In your formula you have Year={'PLAN'}...
How can you have a string, for Year?
If PLAN is a variable then enclose it with parenthesis but it does not seem to be a variable.
I think you need to revisit your formula and correct the errors.
- Mark as New
- Bookmark
- Subscribe
- Mute
- Subscribe to RSS Feed
- Permalink
- Report Inappropriate Content
Hello Manish and Josh,
Plan is a year listed in our model, which is why we can use a string. There are no errors currently, outside of that I cannot visualize how to get the weight or the percentage of earned premium each state is. Ultimately I am just asking how to get the weight relative to the whole so I can multiply that against the variance. Any ideas?