Unlock a world of possibilities! Login now and discover the exclusive benefits awaiting you.
- Qlik Community
- :
- All Forums
- :
- QlikView App Dev
- :
- Re: Bar chart not showing last value of x-axis
- Subscribe to RSS Feed
- Mark Topic as New
- Mark Topic as Read
- Float this Topic for Current User
- Bookmark
- Subscribe
- Mute
- Printer Friendly Page
- Mark as New
- Bookmark
- Subscribe
- Mute
- Subscribe to RSS Feed
- Permalink
- Report Inappropriate Content
Bar chart not showing last value of x-axis
Hi Friends,
I have a Bar chart which misses to show the last value of x-axis. I guess the issue is with the length of text. I have enabled a scroll bar for x-axis when more than 5 values but even that does not show that value. I tried to show the label in 45 Degrees ( / ) but users do not want it since it truncates the labels.
Please let me know if there are any settings that will make it to show all the labels.
Thanks,
- Mark as New
- Bookmark
- Subscribe
- Mute
- Subscribe to RSS Feed
- Permalink
- Report Inappropriate Content
Hi umesh
is it possible to attach your QVW file
Regards
Kushal Thakral
- Mark as New
- Bookmark
- Subscribe
- Mute
- Subscribe to RSS Feed
- Permalink
- Report Inappropriate Content
In the presentation tab, Uncheck 'Limit Legend(Characters)'.
- Mark as New
- Bookmark
- Subscribe
- Mute
- Subscribe to RSS Feed
- Permalink
- Report Inappropriate Content
Hi,
I am attaching an example screenshot here. It contains a line chart and a table. The table shows all the dimension values but the chart misses out the last value that is December. If I change the label to show in 45 degrees ( /) than December shows but it truncates 'er'. But as said users do not want to see the labels in ( / ) format.
I have a constraint of not re-sizing the chart as well.
Thanks,
- Mark as New
- Bookmark
- Subscribe
- Mute
- Subscribe to RSS Feed
- Permalink
- Report Inappropriate Content
in chart properties go to Axis tab and and change primary dimension label from - to / try this hope this helps you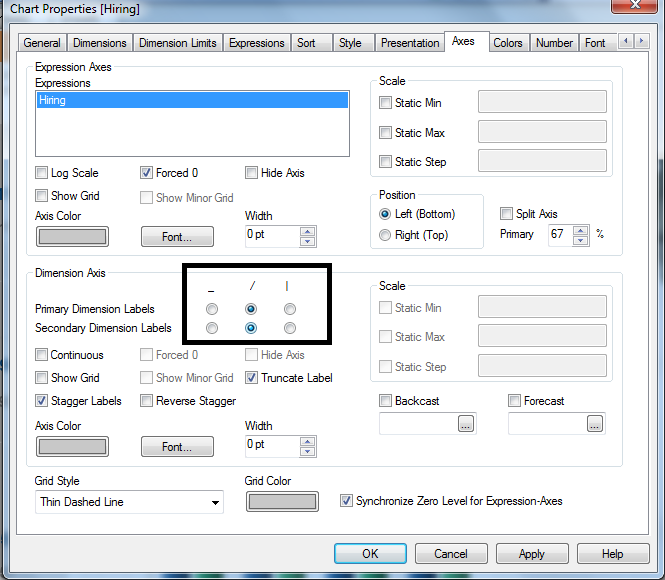
- Mark as New
- Bookmark
- Subscribe
- Mute
- Subscribe to RSS Feed
- Permalink
- Report Inappropriate Content
Hi Bhawna,
I said earlier, if I change the label to ( / ) it truncates last few characters. I have labels which are close to 40 characters.
Thanks,
- Mark as New
- Bookmark
- Subscribe
- Mute
- Subscribe to RSS Feed
- Permalink
- Report Inappropriate Content
In Axis tab, change dimension axis to / and in presentation table uncheck limit legend checkbox. Also make sure that in Dimensions tab, for the dimension "Show All Values" checkbox is checked.
Thanks
Ram
- Mark as New
- Bookmark
- Subscribe
- Mute
- Subscribe to RSS Feed
- Permalink
- Report Inappropriate Content
Umesh,
You can look at using short form for your labels.
thanks,
Rajesh Vaswani