Unlock a world of possibilities! Login now and discover the exclusive benefits awaiting you.
- Qlik Community
- :
- All Forums
- :
- QlikView App Dev
- :
- Re: Bar chart to change dynamically according to s...
Options
- Subscribe to RSS Feed
- Mark Topic as New
- Mark Topic as Read
- Float this Topic for Current User
- Bookmark
- Subscribe
- Mute
- Printer Friendly Page
Turn on suggestions
Auto-suggest helps you quickly narrow down your search results by suggesting possible matches as you type.
Showing results for
Not applicable
2013-11-29
03:46 PM
- Mark as New
- Bookmark
- Subscribe
- Mute
- Subscribe to RSS Feed
- Permalink
- Report Inappropriate Content
Bar chart to change dynamically according to selection
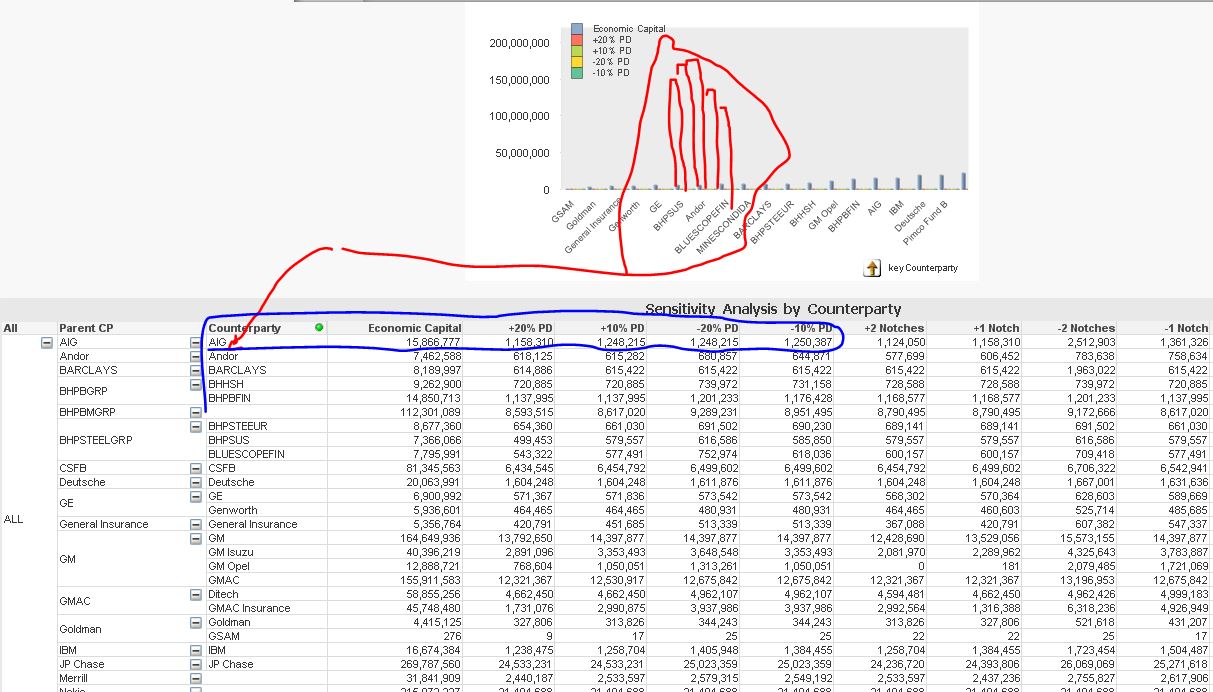
Hi, How do I make the bar chart plot according to the selection in the table. For example when I select ‘AIG’ it will plot 5 bars which is Economic Capital, +20% PD, +10% PD, -20% PD, -10% PD. If I select Andor, the chart will then automatically change to the set of data associated to Andor. Regards, Heok
- Tags:
- new_to_qlikview
477 Views
1 Solution
Accepted Solutions
Not applicable
2013-11-29
04:01 PM
Author
- Mark as New
- Bookmark
- Subscribe
- Mute
- Subscribe to RSS Feed
- Permalink
- Report Inappropriate Content
like this?
409 Views
3 Replies
Not applicable
2013-11-29
03:57 PM
Author
- Mark as New
- Bookmark
- Subscribe
- Mute
- Subscribe to RSS Feed
- Permalink
- Report Inappropriate Content
Your expression has setanalysis with 1
1 means disregard the selection but not the dimension.
You should use $ sign expansion
Not applicable
2013-11-29
04:01 PM
Author
- Mark as New
- Bookmark
- Subscribe
- Mute
- Subscribe to RSS Feed
- Permalink
- Report Inappropriate Content
like this?
410 Views
Not applicable
2013-11-29
04:14 PM
Author
- Mark as New
- Bookmark
- Subscribe
- Mute
- Subscribe to RSS Feed
- Permalink
- Report Inappropriate Content
Thanks Thomas!
409 Views