Unlock a world of possibilities! Login now and discover the exclusive benefits awaiting you.
- Qlik Community
- :
- All Forums
- :
- QlikView App Dev
- :
- Bar chart with multiple expression how to make lab...
- Subscribe to RSS Feed
- Mark Topic as New
- Mark Topic as Read
- Float this Topic for Current User
- Bookmark
- Subscribe
- Mute
- Printer Friendly Page
- Mark as New
- Bookmark
- Subscribe
- Mute
- Subscribe to RSS Feed
- Permalink
- Report Inappropriate Content
Bar chart with multiple expression how to make label at X axis ?
Hi All
I need the below label to place at X axis ::-
30 Day 60 Day 90 Day
any idea how to do it ?
Paul
Accepted Solutions
- Mark as New
- Bookmark
- Subscribe
- Mute
- Subscribe to RSS Feed
- Permalink
- Report Inappropriate Content
- Mark as New
- Bookmark
- Subscribe
- Mute
- Subscribe to RSS Feed
- Permalink
- Report Inappropriate Content
Enclosed my QV doc
- Mark as New
- Bookmark
- Subscribe
- Mute
- Subscribe to RSS Feed
- Permalink
- Report Inappropriate Content
OK... but what result you are expecting?
30 Days will show what in bar chart?
Create a bar Chart
Dimension
Calculated Dimension
=ValueList('30 Day', '60 Day', '90 Day')
Expression
IF(ValueList('30 Day', '60 Day', '90 Day') = '30 Day',
NUM(SUM(
IF(CURRENCY='EUR',DAY30*1.64,
IF(CURRENCY='NT',DAY30/24,
IF(CURRENCY='USD',DAY30*1.25,
IF(CURRENCY='YEN',DAY30*0.012,
IF(CURRENCY='SGD',DAY30*1))
)))),'#,##0'),
IF(ValueList('30 Day', '60 Day', '90 Day') = '60 Day',
NUM(SUM(
IF(CURRENCY='EUR',DAY60*1.64,
IF(CURRENCY='NT',DAY60/24,
IF(CURRENCY='USD',DAY60*1.25,
IF(CURRENCY='YEN',DAY60*0.012,
IF(CURRENCY='SGD',DAY60*1))
)))),'#,##0'),
IF(ValueList('30 Day', '60 Day', '90 Day') = '90 Day',
NUM(SUM(
IF(CURRENCY='EUR',DAY90*1.64,
IF(CURRENCY='NT',DAY90/24,
IF(CURRENCY='USD',DAY90*1.25,
IF(CURRENCY='YEN',DAY90*0.012,
IF(CURRENCY='SGD',DAY90*1))
)))),'#,##0'))))
- Mark as New
- Bookmark
- Subscribe
- Mute
- Subscribe to RSS Feed
- Permalink
- Report Inappropriate Content
Hi sir
Thank you for your help. I expect the label to display on below the bar .
And not group in 1 box.
If you open my qv doc . You will notice I have show the chart with label I
manually place there.
Paul
- Mark as New
- Bookmark
- Subscribe
- Mute
- Subscribe to RSS Feed
- Permalink
- Report Inappropriate Content
Hi,
Please find attached file for solution.
Regards,
Jagan.
- Mark as New
- Bookmark
- Subscribe
- Mute
- Subscribe to RSS Feed
- Permalink
- Report Inappropriate Content
Hi Paul Yeo,
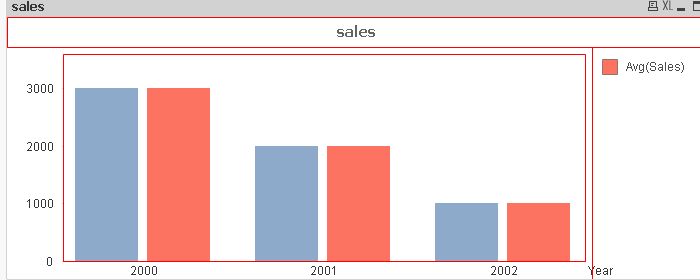
use the option Ctrl+Shift and drag the legend to the X-axis.

Ctrl+shift on the chart , you can visualize the above chart.

drag and drop the legend to the position u want
- Mark as New
- Bookmark
- Subscribe
- Mute
- Subscribe to RSS Feed
- Permalink
- Report Inappropriate Content
Manish and Jagan's proposed solutions may certainly work, but I think you are better off remodeling the data to be more flexible and ditching the complex if()s.
1. Create a Currency table that associates Currency Name with the Currency Rate.
2. Make Aging days bucket an attribute of your facts and put the amount into a common Amount field. Then just use "Aging Bucket" as the dimension and "sum(Amount)" as the expression.
If you do it that way, you no longer have to maintain currency rates and bucket names over multiple expressions and calculated dimensions.
-Rob
- Mark as New
- Bookmark
- Subscribe
- Mute
- Subscribe to RSS Feed
- Permalink
- Report Inappropriate Content
hI rOB
Thank you for your offer.
On the step 2 i cannot understand , may be you can help me by show me how the table will be look like.
Paul
- Mark as New
- Bookmark
- Subscribe
- Mute
- Subscribe to RSS Feed
- Permalink
- Report Inappropriate Content
Hi All
Thank you for your sharing . it work fine for my chart . but i still like to try Rob proposal.
Paul
- Mark as New
- Bookmark
- Subscribe
- Mute
- Subscribe to RSS Feed
- Permalink
- Report Inappropriate Content
Just wondering, was my answer different from Jagan's answer?![]()