Unlock a world of possibilities! Login now and discover the exclusive benefits awaiting you.
- Qlik Community
- :
- All Forums
- :
- QlikView App Dev
- :
- BarChart
- Subscribe to RSS Feed
- Mark Topic as New
- Mark Topic as Read
- Float this Topic for Current User
- Bookmark
- Subscribe
- Mute
- Printer Friendly Page
- Mark as New
- Bookmark
- Subscribe
- Mute
- Subscribe to RSS Feed
- Permalink
- Report Inappropriate Content
BarChart
Hi community,
It's my first time using Bar chart, and I'm hopeless.
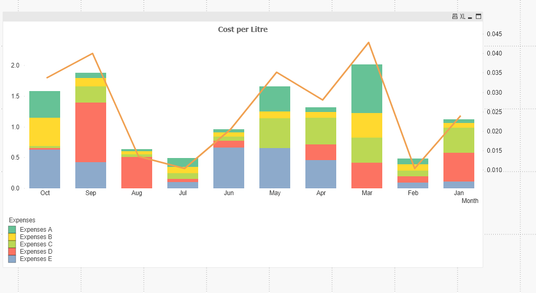
I have been asked to create a bar chart as displayed in the excel attached, sheet "BarChart"
Can someone please help me to create this bar chart in QV?
In addition, I attached a QVW for example with the excel with the DB, Sheet "DB".
Thanks in advance!
- Mark as New
- Bookmark
- Subscribe
- Mute
- Subscribe to RSS Feed
- Permalink
- Report Inappropriate Content
This would have to be two objects - a straight/pivot table and a combo chart object. It not easy to create a stacked bar chart and a line on the same chart though.
- Mark as New
- Bookmark
- Subscribe
- Mute
- Subscribe to RSS Feed
- Permalink
- Report Inappropriate Content
I do not quite understand what do you mean in creating two objects, is it possible to have an example
- Mark as New
- Bookmark
- Subscribe
- Mute
- Subscribe to RSS Feed
- Permalink
- Report Inappropriate Content
You would want a Combo chart to have both, but per the other poster, not sure if it will work or not, here is the Help link to that chart type:
Did a quick check in the Design Blog area, did not really see much there that would be of further help on this one.
Regards,
Brett
I now work a compressed schedule, Tuesday, Wednesday and Thursday, so those will be the days I will reply to any follow-up posts.
- Mark as New
- Bookmark
- Subscribe
- Mute
- Subscribe to RSS Feed
- Permalink
- Report Inappropriate Content
Something like this:
There's two chart overlapping each other in actual.
Refer qvw attached as reference.
Thanks and regards,
Arthur Fong
