Unlock a world of possibilities! Login now and discover the exclusive benefits awaiting you.
- Qlik Community
- :
- All Forums
- :
- QlikView
- :
- Barchart with calculation on x-axis
- Subscribe to RSS Feed
- Mark Topic as New
- Mark Topic as Read
- Float this Topic for Current User
- Bookmark
- Subscribe
- Mute
- Printer Friendly Page
- Mark as New
- Bookmark
- Subscribe
- Mute
- Subscribe to RSS Feed
- Permalink
- Report Inappropriate Content
Barchart with calculation on x-axis
Hello,
I have the following scenario for which I can't seem to find a good solution:
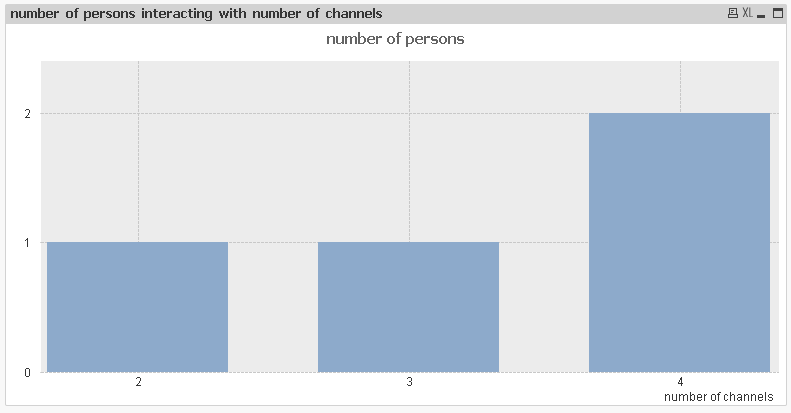
For a multichannel report, I want to see how many people interacted with how many channels.
I want to represent this in a bar-chart, showing:
On the x-axis: the number of channels sequentially listed (eg: 1 - 2 - 3 - 4 - 5 - 6 - ...)
On the y-axis: the number of people that have interacted with the number of channels from the x-axis
So basically, the chart would answer a question like: "How many people interacted with exactly 4 channels".
I have no clue however on how to tackle this in a clean proper way.
Any help would be greatly appreciated.
Kind regards,
Christophe
- Tags:
- new_to_qlikview
- « Previous Replies
-
- 1
- 2
- Next Replies »
Accepted Solutions
- Mark as New
- Bookmark
- Subscribe
- Mute
- Subscribe to RSS Feed
- Permalink
- Report Inappropriate Content
Create a straight table or Bar Chart
Dimension = Calculated Dimension
=Class(Aggr(COUNT(DISTINCT Channel),PersonID),1)
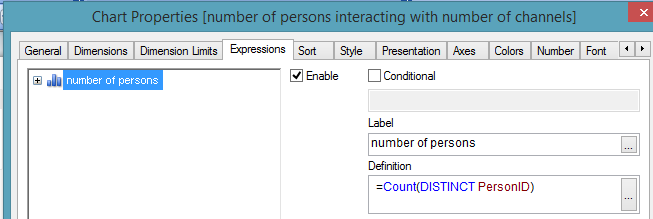
Expression
Count(DISTINCT PersonID)
- Mark as New
- Bookmark
- Subscribe
- Mute
- Subscribe to RSS Feed
- Permalink
- Report Inappropriate Content
Kindly Provide Sample Data...
You can use Class Function with Calculated Dimension.
- Mark as New
- Bookmark
- Subscribe
- Mute
- Subscribe to RSS Feed
- Permalink
- Report Inappropriate Content
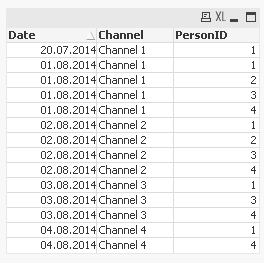
I've attached it to this reply.
You can see 4 persons interacting with 4 channels.
Person 1 has 4 channels interacted with (although there are 5 total interactions)
Person 2 has 2 channels interacted with
Person 3 has 3
Person 4 has 4
Thanks in advance for looking into this
- Mark as New
- Bookmark
- Subscribe
- Mute
- Subscribe to RSS Feed
- Permalink
- Report Inappropriate Content
Hi Chris
You can do this two ways
- you can create a new table and the original table will be connected via personid
- can add a new field to the existing table by left join
Please see below code for new table
Channels:LOAD Date,
Channel,
PersonIDFROM
C:\Users\padmap\Documents\QlikView\Examples\Channels.xlsx
(ooxml, embedded labels, table is Channel);
NoofChannels:
Load PersonID,Count(Channel) as NoofChannels Resident ChannelsGroup by PersonID;
Thanks n regards
PAdma
- Mark as New
- Bookmark
- Subscribe
- Mute
- Subscribe to RSS Feed
- Permalink
- Report Inappropriate Content
Hi,
If you want for each Person, the no. of channels interacted with then
Dimension would be PersonID
Expression would be Count(Distinct Channel)
If you want for each Channel, the no. of persons interacted with then
Dimension would be Channel
Expression would be Count(Distinct Person ID)
Above two solutions are given as the post first and latest replies are put up differently.
Always remember Dimension is the context across which you want to show up a calculated value(Measure) 
Thanks
Sri
- Mark as New
- Bookmark
- Subscribe
- Mute
- Subscribe to RSS Feed
- Permalink
- Report Inappropriate Content
Create a straight table or Bar Chart
Dimension = Calculated Dimension
=Class(Aggr(COUNT(DISTINCT Channel),PersonID),1)
Expression
Count(DISTINCT PersonID)
- Mark as New
- Bookmark
- Subscribe
- Mute
- Subscribe to RSS Feed
- Permalink
- Report Inappropriate Content
Why not solve it with a scatter chart?
Then you are able to use these measures on both axis:
On the x-axis: the number of channels
On the y-axis: the number of people
If you do not have a dimension you can probably use a calculated dimension only containing a text string, like a space or something descriptive.
- Mark as New
- Bookmark
- Subscribe
- Mute
- Subscribe to RSS Feed
- Permalink
- Report Inappropriate Content
Hi,
I gree that doing this in the front end is more flexible than a aggregation at script level.
The class function doesn't seem to be necessary though:
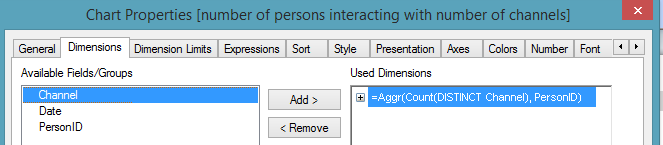
hope this helps
regards
Marco
- Mark as New
- Bookmark
- Subscribe
- Mute
- Subscribe to RSS Feed
- Permalink
- Report Inappropriate Content
Thanks, this worked for me !
Just wondering: how do you get rid of the autogenerated labels like "5 <= x <6" while all I need is "5".
- Mark as New
- Bookmark
- Subscribe
- Mute
- Subscribe to RSS Feed
- Permalink
- Report Inappropriate Content
Just don't use the class function in this case.
- « Previous Replies
-
- 1
- 2
- Next Replies »