Unlock a world of possibilities! Login now and discover the exclusive benefits awaiting you.
- Qlik Community
- :
- All Forums
- :
- QlikView App Dev
- :
- Re: Base on value color change
- Subscribe to RSS Feed
- Mark Topic as New
- Mark Topic as Read
- Float this Topic for Current User
- Bookmark
- Subscribe
- Mute
- Printer Friendly Page
- Mark as New
- Bookmark
- Subscribe
- Mute
- Subscribe to RSS Feed
- Permalink
- Report Inappropriate Content
Base on value color change
hi
i am having value in straight table using expression like sum(amount) so result like this
amount
2500
2320
2210
2010
1980
1500
1504
based on the input box value it will bring the highest value in straight table.
now i want to show difference in color. for example red color means based on value the red color should be differ
please suggest some ideas
thanks
- Tags:
- new_to_qlikview
- « Previous Replies
- Next Replies »
- Mark as New
- Bookmark
- Subscribe
- Mute
- Subscribe to RSS Feed
- Permalink
- Report Inappropriate Content
What do you mean?
Can you attached screenshot/data Sample?
- Mark as New
- Bookmark
- Subscribe
- Mute
- Subscribe to RSS Feed
- Permalink
- Report Inappropriate Content
Hi arulsettu ,
Kindly open attached qvw file.
Look for Sheet 2. Limit the Top n values by Var2 Variable in input box.
Is this solves your Purpose exactly??
- Mark as New
- Bookmark
- Subscribe
- Mute
- Subscribe to RSS Feed
- Permalink
- Report Inappropriate Content
Hi,
Use pick and match function in expression tab under background color.
Ex: pick(match(sum(sales)>2500),red())... or you also use If()
- Mark as New
- Bookmark
- Subscribe
- Mute
- Subscribe to RSS Feed
- Permalink
- Report Inappropriate Content
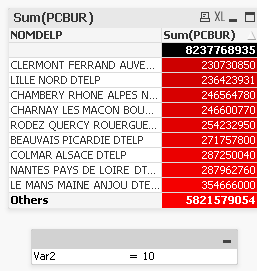
This is what I get:
- Mark as New
- Bookmark
- Subscribe
- Mute
- Subscribe to RSS Feed
- Permalink
- Report Inappropriate Content
Yes Robert. It shows the color getting brighter as value increases.
- Mark as New
- Bookmark
- Subscribe
- Mute
- Subscribe to RSS Feed
- Permalink
- Report Inappropriate Content
Yes it does sorry.
The change was so small that I can not see it...ups
- Mark as New
- Bookmark
- Subscribe
- Mute
- Subscribe to RSS Feed
- Permalink
- Report Inappropriate Content
Try the ColorMix wizard. Open the Background Color Expression and open the expression editor. The wizard is located under File, Colormix wizard. Follow the prompts.
See: colormix » The Qlik Board!
I also tackle this problem by varying transparency. Check out this recipe for an example:
Qlikview Cookbook: Heat Table Chart http://qlikviewcookbook.com/recipes/download-info/heat-table-chart/
-Rob
- « Previous Replies
- Next Replies »