Unlock a world of possibilities! Login now and discover the exclusive benefits awaiting you.
- Qlik Community
- :
- All Forums
- :
- QlikView App Dev
- :
- Basic % expression help
- Subscribe to RSS Feed
- Mark Topic as New
- Mark Topic as Read
- Float this Topic for Current User
- Bookmark
- Subscribe
- Mute
- Printer Friendly Page
- Mark as New
- Bookmark
- Subscribe
- Mute
- Subscribe to RSS Feed
- Permalink
- Report Inappropriate Content
Basic % expression help
New to QlikView and don't know how to create a percentage expression for string field with 2 values in a chart.
- Tags:
- new_to_qlikview
- « Previous Replies
-
- 1
- 2
- Next Replies »
Accepted Solutions
- Mark as New
- Bookmark
- Subscribe
- Mute
- Subscribe to RSS Feed
- Permalink
- Report Inappropriate Content
Hello Racine,
Please find attached qvw.
Please let me know if it was helpful or anything else is required.
Thanks,
Angad
- Mark as New
- Bookmark
- Subscribe
- Mute
- Subscribe to RSS Feed
- Permalink
- Report Inappropriate Content
right click--> properties--> go to number tab(select a field for which you want to show in %)--> check show in percent option.
- Mark as New
- Bookmark
- Subscribe
- Mute
- Subscribe to RSS Feed
- Permalink
- Report Inappropriate Content
Hello Racine,
You can add a new expression with Field1/Field2 and then on Number Tab, select that expression and select Number radio button and then Show in Percent checkbox.
Thanks,
itsangad
- Mark as New
- Bookmark
- Subscribe
- Mute
- Subscribe to RSS Feed
- Permalink
- Report Inappropriate Content
Thanks but my problem is even more basic than that. I don't know how to create a percentage expression e.g.
"Male" and "Female" values in field "Gender".
- Mark as New
- Bookmark
- Subscribe
- Mute
- Subscribe to RSS Feed
- Permalink
- Report Inappropriate Content
It's a percentage in the same string field e.g. "Male" and "Female" in field "Gender".
- Mark as New
- Bookmark
- Subscribe
- Mute
- Subscribe to RSS Feed
- Permalink
- Report Inappropriate Content
Hello Racine,
Please find attached qvw.
Please let me know if it was helpful, or anything else is required.
Thanks,
Angad
- Mark as New
- Bookmark
- Subscribe
- Mute
- Subscribe to RSS Feed
- Permalink
- Report Inappropriate Content
Hello Racine,
If you cannot open the qlikview, then please find below explanation :
Write this in Script and then Reload
LOAD * INLINE [
Gender
MALE
MALE
FEMALE
FEMALE
FEMALE
];
Then right click on the sheet and create a chart(Straight Table) with following settings :
Dimension : Gender
Expression1 : =count(Gender)
Expression2 : =count(Gender)/count(TOTAL Gender), for the on the Number tab, select the Integer radio button and select Show in Percent checkbox.
Please let me know if this was helpful or anything else is required.
Thanks,
Angad
- Mark as New
- Bookmark
- Subscribe
- Mute
- Subscribe to RSS Feed
- Permalink
- Report Inappropriate Content
Thank you very much for this and it does make sense. I've still got the problem that I want the % by another variable in a QlikView chart e.g. gender by year of entry, so that each year has the 100% broken down.
- Mark as New
- Bookmark
- Subscribe
- Mute
- Subscribe to RSS Feed
- Permalink
- Report Inappropriate Content
Hello Racine,
Can you please attach sample qvw with expected results. It might make things easier for me to understand.
Thanks,
itsangad
- Mark as New
- Bookmark
- Subscribe
- Mute
- Subscribe to RSS Feed
- Permalink
- Report Inappropriate Content
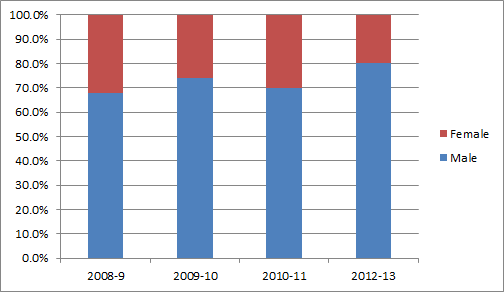
I want a chart like this in QlikView:-
- « Previous Replies
-
- 1
- 2
- Next Replies »