Unlock a world of possibilities! Login now and discover the exclusive benefits awaiting you.
- Qlik Community
- :
- All Forums
- :
- QlikView App Dev
- :
- Re: Best Design for Absence Planner
- Subscribe to RSS Feed
- Mark Topic as New
- Mark Topic as Read
- Float this Topic for Current User
- Bookmark
- Subscribe
- Mute
- Printer Friendly Page
- Mark as New
- Bookmark
- Subscribe
- Mute
- Subscribe to RSS Feed
- Permalink
- Report Inappropriate Content
Best Design for Absence Planner
Hi,
I have all our data for abscene in qlikview, and I need to design an abscence planner similar to the design below:
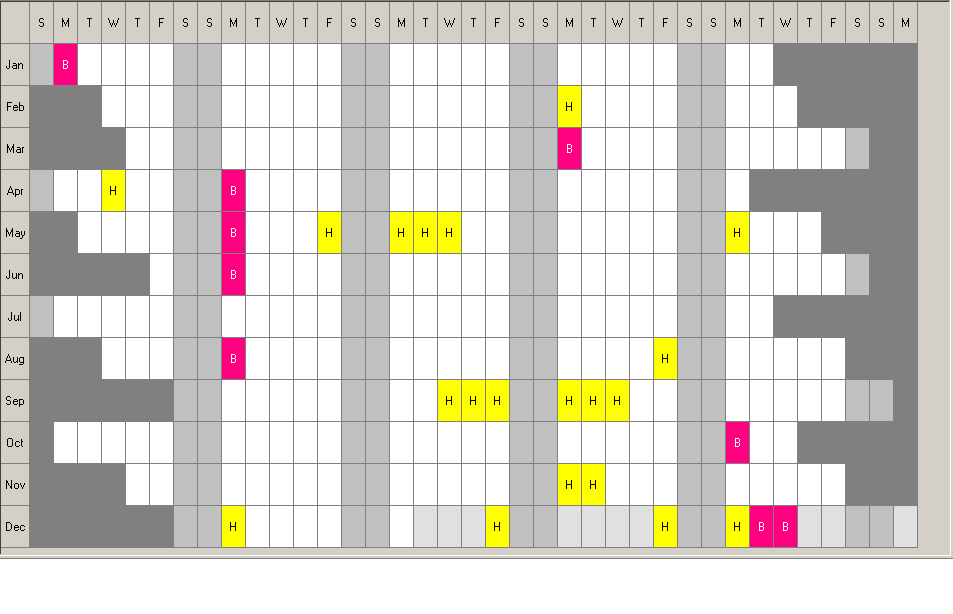
I know I will need to use conditional formatting for the different codes which I have and that is fine but I was wondering does anybody know the best object I could use to replicate this in qlikview? I tried a pivot chart but I couldn't seem to get the format right.
There will be 3 fields used:
Month
Day
HCode
Thanks,
Gregg
Accepted Solutions
- Mark as New
- Bookmark
- Subscribe
- Mute
- Subscribe to RSS Feed
- Permalink
- Report Inappropriate Content
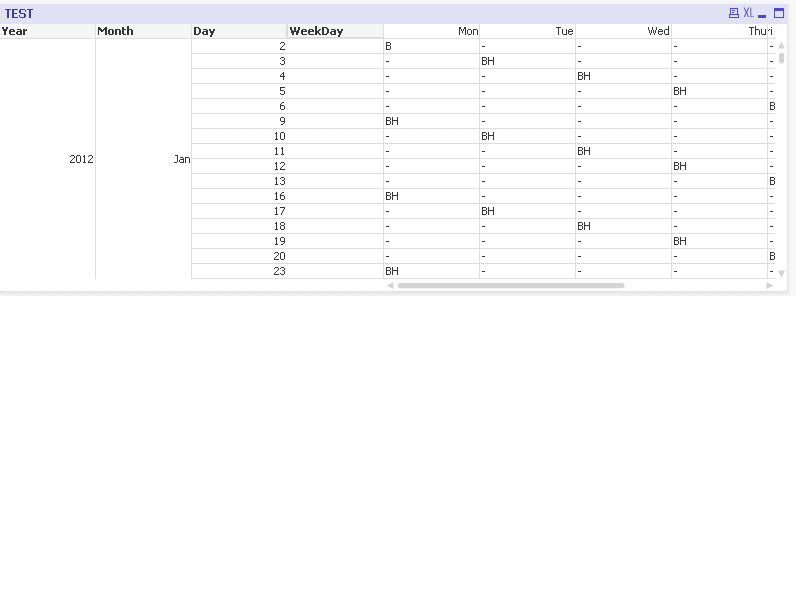
Make sure your chart is a povot table.
then click "Day" heading and drag it
See the attachments (Can't embed the images for some reason)
(Also I just noticed you have day number as a dimension, you don't need that you need the week number for the month)
This was on the document I already uploaded, but here it is again..
=if(month(weekend(Date))= month(Date),div(day(WeekEnd(Date)),7),div(day(Weekend(Date,-1)),7)+1)+1
- Mark as New
- Bookmark
- Subscribe
- Mute
- Subscribe to RSS Feed
- Permalink
- Report Inappropriate Content
you'll need to use something like this for conditional formatting in background color while writing ur expression
if(rangemin(.5,rangemax(condition),-.5)) < 0,
-Sqrt(-(rangemin(.5,rangemax(condition),-.5)))/(-.5)),
Sqrt((rangemin(.5,rangemax(condition),-.5)))/(.5))),
ARGB(255, 255, 0, 0), ARGB(255, 0, 255, 0), ARGB(255, 255, 255, 255))
- Mark as New
- Bookmark
- Subscribe
- Mute
- Subscribe to RSS Feed
- Permalink
- Report Inappropriate Content
Hi,
Thanks for that. At the moment I am concentrating more on the design of the object for now.
I need to use a landscape table and pivot off the month as far as I can see but am struggling with this.
Regards,
Gregg
- Mark as New
- Bookmark
- Subscribe
- Mute
- Subscribe to RSS Feed
- Permalink
- Report Inappropriate Content
Hi!
Maybe you can create a table with inline fields by day and month with a calendar and then do all the calculations via rule.
Rebeca
- Mark as New
- Bookmark
- Subscribe
- Mute
- Subscribe to RSS Feed
- Permalink
- Report Inappropriate Content
See the example attached.
Mark
- Mark as New
- Bookmark
- Subscribe
- Mute
- Subscribe to RSS Feed
- Permalink
- Report Inappropriate Content
Thanks Mark.
Can you let me know what the following piece of code does:
load dual (WeekDay(Date),DayOfMonth) as X
Thanks,
Gregg
- Mark as New
- Bookmark
- Subscribe
- Mute
- Subscribe to RSS Feed
- Permalink
- Report Inappropriate Content
Ignore that, I meant to take that out  (please mark my answer as correct if you are happy with it!)
- Mark as New
- Bookmark
- Subscribe
- Mute
- Subscribe to RSS Feed
- Permalink
- Report Inappropriate Content
No problem!
Just another question. How did you get each day number across the “D” expression?
I have a calendar table with Week Day but I can’t get it to repeat the days across the chart as you do:
My Calendar code is:
LET varMinDate = Num('01/01/2012');
LET varMaxDate = Num(today());
LET varToDay = Num(today());
//************** Temporary Calendar *************
TempCalendar:
LOAD
$(varMinDate) + rowno() - 1 AS Num,
date($(varMinDate) + rowno() -1) AS TempDate
AutoGenerate $(varMaxDate) - $(varMinDate) + 1;
MasterCalendar:
LOAD TempDate AS Date,
Week(TempDate) AS Week,
Year(TempDate) AS Year,
Month(TempDate) AS Month,
Day(TempDate) AS Day,
WeekDay(TempDate) AS WeekDay,
'Q' & Ceil(Month(TempDate) / 3 ) AS Quarter,
Date(MonthStart(TempDate), 'MMM-YYYY') AS MonthYear,
num(Week(TempDate),'00')&'-'&WeekYear(TempDate) AS WeekYear,
InYearToDate(TempDate,$(varToDay),0)* -1 AS CurYTDFlag,
InYearToDate(TempDate,$(varToDay),-1)* -1 AS LastYTDFlag
Resident TempCalendar
ORDER BY TempDate ASC;
DROP Table TempCalendar;
Thanks,
Gregg
- Mark as New
- Bookmark
- Subscribe
- Mute
- Subscribe to RSS Feed
- Permalink
- Report Inappropriate Content
Make sure your chart is a povot table.
then click "Day" heading and drag it
See the attachments (Can't embed the images for some reason)
(Also I just noticed you have day number as a dimension, you don't need that you need the week number for the month)
This was on the document I already uploaded, but here it is again..
=if(month(weekend(Date))= month(Date),div(day(WeekEnd(Date)),7),div(day(Weekend(Date,-1)),7)+1)+1
- Mark as New
- Bookmark
- Subscribe
- Mute
- Subscribe to RSS Feed
- Permalink
- Report Inappropriate Content
Thanks Mark Got it now.
Regards,
Gregg