Unlock a world of possibilities! Login now and discover the exclusive benefits awaiting you.
- Qlik Community
- :
- All Forums
- :
- QlikView App Dev
- :
- Re: Block Chart query
- Subscribe to RSS Feed
- Mark Topic as New
- Mark Topic as Read
- Float this Topic for Current User
- Bookmark
- Subscribe
- Mute
- Printer Friendly Page
- Mark as New
- Bookmark
- Subscribe
- Mute
- Subscribe to RSS Feed
- Permalink
- Report Inappropriate Content
Block Chart query
Hi,
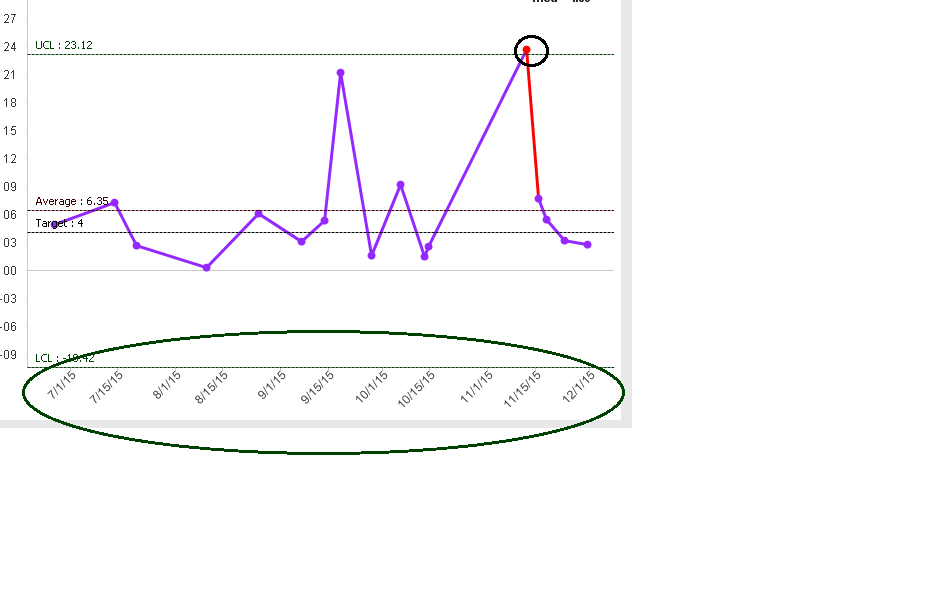
In the below image of line chart, I have to color the data points which is above UCL in red color, as highlighted with black circle. I have used combo chart here. Here, as you can see along with the dot, the connecting line is also coming in red color.
My query is that, I just want to provide red color to dots (i.e. data point), the connecting line should be in purple color.
Please let me know how it can be achieve.
2nd Query:
In the below image, look into the part which is highlighted in green color circle. Here for the x-axis label, I have selected the Option Continuous and unchecked the Stagger level, so that the date label should appear in particular interval.
My concern is that, this interval is dynamic for x-axis. I would like to fix the interval i.e., the label should appear week wise, i.e. at the interval 7 days. Please let me how it can be achieve in qlikview.
Thanks in advance for helping me.!!!!
- Tags:
- new_to_qlikview
- Mark as New
- Bookmark
- Subscribe
- Mute
- Subscribe to RSS Feed
- Permalink
- Report Inappropriate Content
I would suggest you look into coloring the object for a specific expression. You can wirte an expression to set the color (background color)
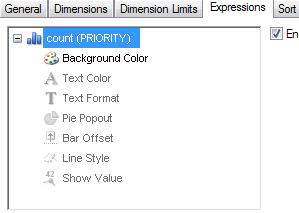
the example below shows setting the color based on a value in the field priority
(if(PRIORITY='Urgent',RGB(255,0,0), if(PRIORITY='Low',RGB(0,128,0), if(PRIORITY='Medium',RGB(239,179,118), if(PRIORITY='High',RGB(178,36,36))))))
you can do something similar
Regarding your second question, who are the dates coming into the system or being determined now? it looks like they are the 1st and 15th of each month - you may need to create a new dimension in your script to look at a date field and get the first date of the week or something along those lines
do you have a qvw you can post?
- Mark as New
- Bookmark
- Subscribe
- Mute
- Subscribe to RSS Feed
- Permalink
- Report Inappropriate Content
Hi,
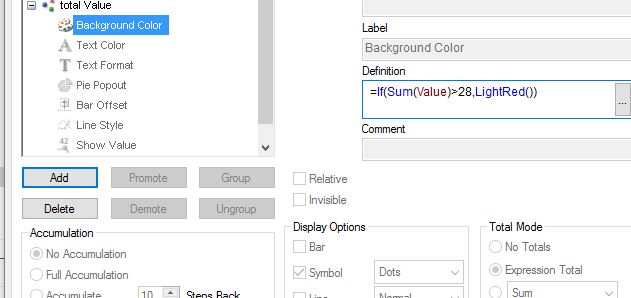
maybe you could use a conditional background colour expression like this:
Please also close your open threads that received correct answers:
To get number of hours between 2 dates
thanks
hope this helps
regards
Marco
- Mark as New
- Bookmark
- Subscribe
- Mute
- Subscribe to RSS Feed
- Permalink
- Report Inappropriate Content
Hi Wedel,
This is exactly what I need for dots color coding. Can you please share the sample QVW solution for the same. I will use it for reference.
Thanks,
Sweta
- Mark as New
- Bookmark
- Subscribe
- Mute
- Subscribe to RSS Feed
- Permalink
- Report Inappropriate Content
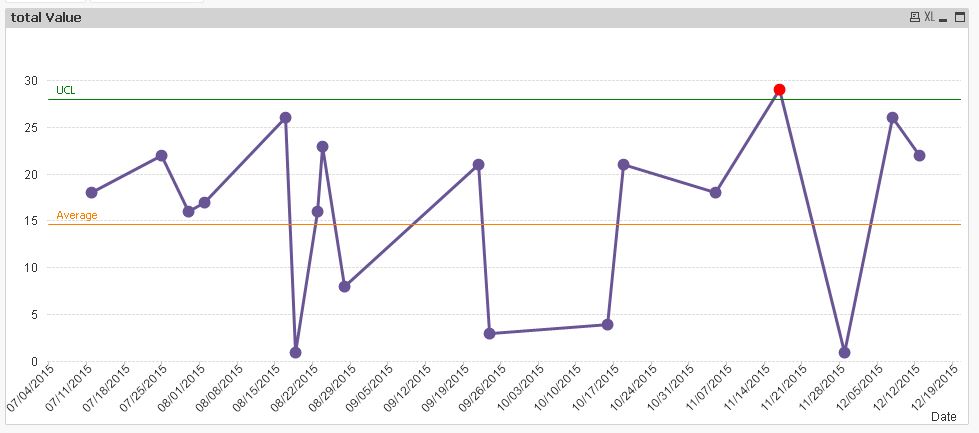
Hi,
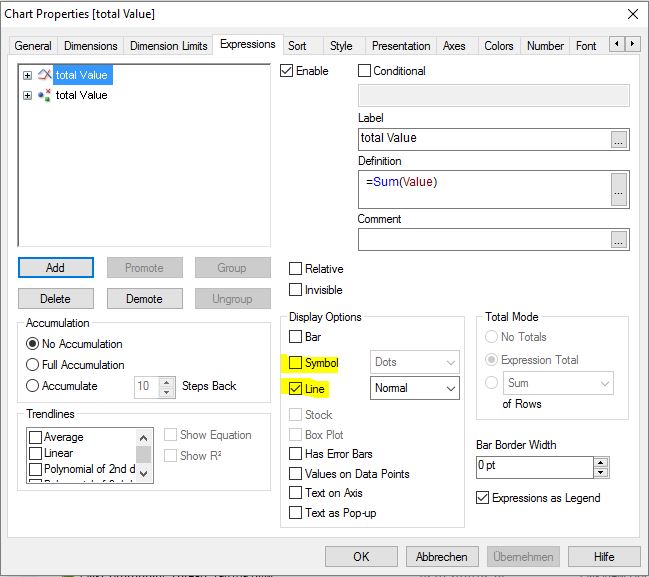
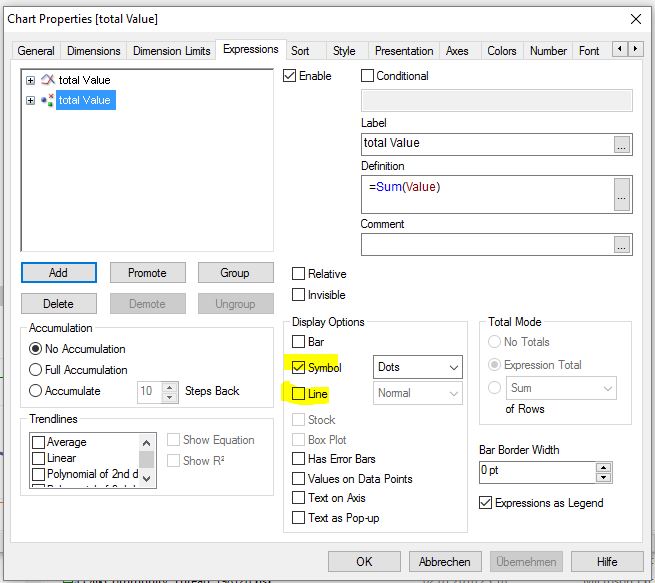
try with two identical expressions and set display options to "line" for one of the expressions while setting the second to "symbol". Use the color expression only for the symbol expression.
hope this helps
regards
Marco
- Mark as New
- Bookmark
- Subscribe
- Mute
- Subscribe to RSS Feed
- Permalink
- Report Inappropriate Content
Hi Marco,
Thanks.. It worked for me.
I am having one more query in chart.
I have to change the font size of Reference lines label and also I have to make it bold.
I would like to know whether it is possible in QLikView,
Thanks in advance..!!!
- Mark as New
- Bookmark
- Subscribe
- Mute
- Subscribe to RSS Feed
- Permalink
- Report Inappropriate Content
Hi,
yes, that's possible.
please close this thread if your inital question is answered and open a new one for these new questions.
thanks
regards
Marco