Unlock a world of possibilities! Login now and discover the exclusive benefits awaiting you.
- Qlik Community
- :
- All Forums
- :
- QlikView App Dev
- :
- Re: Re: Box plot chart
- Subscribe to RSS Feed
- Mark Topic as New
- Mark Topic as Read
- Float this Topic for Current User
- Bookmark
- Subscribe
- Mute
- Printer Friendly Page
- Mark as New
- Bookmark
- Subscribe
- Mute
- Subscribe to RSS Feed
- Permalink
- Report Inappropriate Content
Box plot chart
Hi All,
How to create a box plot chart in Web version of qlikview? I am able to achieve it in desktop version but not sure in web version.
Your responses would be highly appreciated.
Thanks,
MC
- Tags:
- new_to_qlikview
- Mark as New
- Bookmark
- Subscribe
- Mute
- Subscribe to RSS Feed
- Permalink
- Report Inappropriate Content
I don't think it's possible. Possibly by purpose. Box plot has five values, it would be quite messy to show.
- Mark as New
- Bookmark
- Subscribe
- Mute
- Subscribe to RSS Feed
- Permalink
- Report Inappropriate Content
Thanks Michael..Is it possible to show as pop up text?? Without out any values users are finding hard to know the exact value.
Thanks,
MC
- Mark as New
- Bookmark
- Subscribe
- Mute
- Subscribe to RSS Feed
- Permalink
- Report Inappropriate Content
The pop-up option is not available. Best case probably is to create an invisible expression there and use it for numbers on axes. But it would be only one number, not five.
- Mark as New
- Bookmark
- Subscribe
- Mute
- Subscribe to RSS Feed
- Permalink
- Report Inappropriate Content
I tried so many options but nothing works. I think qlikview has to provide an easy option to show all the 5 values.
I have followed last option in this thread but no luck: 
- Mark as New
- Bookmark
- Subscribe
- Mute
- Subscribe to RSS Feed
- Permalink
- Report Inappropriate Content
Please let me know if there are any other options available?
Thanks,
MC
- Mark as New
- Bookmark
- Subscribe
- Mute
- Subscribe to RSS Feed
- Permalink
- Report Inappropriate Content
I didn't see the post you mentioned, going to try later. For now, see my test with "text on axis". I used only three expressions here: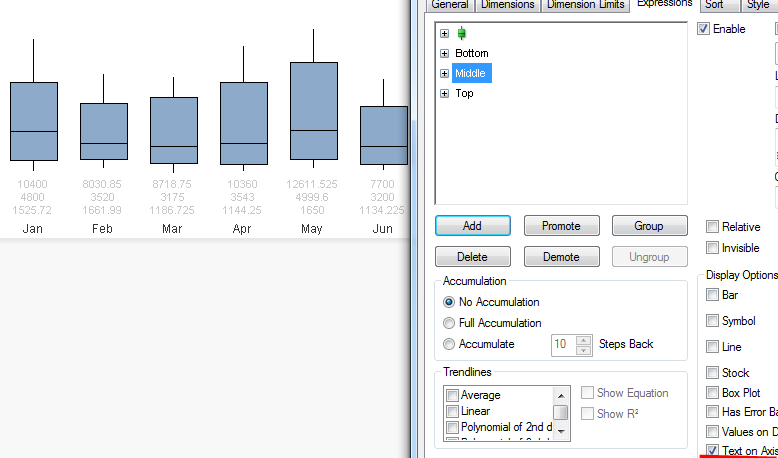
- Mark as New
- Bookmark
- Subscribe
- Mute
- Subscribe to RSS Feed
- Permalink
- Report Inappropriate Content
Thanks Michael Solomovich .. I will wait for your Solution.
- Mark as New
- Bookmark
- Subscribe
- Mute
- Subscribe to RSS Feed
- Permalink
- Report Inappropriate Content
I tried solution offered by Gabriel Gejman in the link you provided earlier - it worked beautifully
In my test, I added the bar expression (it must be on top) with the label
='Upper Whisker: ' & fractile({<Actual={'>0'}>} Actual, 0.8)
&chr(10)&
'Top: ' & fractile({<Actual={'>0'}>} Actual, 0.75)
&chr(10)&
'Median: ' & median({<Actual={'>0'}>} Actual)
&chr(10)&
'Bottom: ' & fractile({<Actual={'>0'}>} Actual, 0.25)
&chr(10)&
'Lower Whisker: ' & fractile({<Actual={'>0'}>} Actual, 0.1)
and expression definition
fractile({<Actual={'>0'}>} Actual, 0.8)
(it covers area from 0 to the top of the upper whisker, you may want to limit it as in the original post)
Background color - used blue(0). It could be any color but transparent, hence 0 here.
Regards,
Michael
- Mark as New
- Bookmark
- Subscribe
- Mute
- Subscribe to RSS Feed
- Permalink
- Report Inappropriate Content
Thank you so much Michael Solomovich .can you please send me the screenshot of your settings/properties..I tried the same but didn't work..Same value repeats across all the bars.
Thanks,
MC
- Mark as New
- Bookmark
- Subscribe
- Mute
- Subscribe to RSS Feed
- Permalink
- Report Inappropriate Content
...Same value repeats across all the bars.
You're right, I wasn't careful - label calculates over all data, not per dimension value.
This makes more sense:
Label is blank. Use space, otherwise expression itself will be shown as label.
Expression definition, in my case:
=dual(
// text to show in pop-up:
chr(10)& // to move the text below the "=" sign; can't remove it
'Upper Whisker: ' & fractile({<Actual={'>0'}>} Actual, 0.8)
&chr(10)&
'Top: ' & fractile({<Actual={'>0'}>} Actual, 0.75)
&chr(10)&
'Median: ' & median({<Actual={'>0'}>} Actual)
&chr(10)&
'Bottom: ' & fractile({<Actual={'>0'}>} Actual, 0.25)
&chr(10)&
'Lower Whisker: ' & fractile({<Actual={'>0'}>} Actual, 0.1)
,
// value for the bar height:
fractile({<Actual={'>0'}>} Actual, 0.8)
)
All ther other properties are the same. Hope this is close to what you need...
Regards,
Michael