Unlock a world of possibilities! Login now and discover the exclusive benefits awaiting you.
- Qlik Community
- :
- All Forums
- :
- QlikView App Dev
- :
- Re: Break in Straight table after field change
- Subscribe to RSS Feed
- Mark Topic as New
- Mark Topic as Read
- Float this Topic for Current User
- Bookmark
- Subscribe
- Mute
- Printer Friendly Page
- Mark as New
- Bookmark
- Subscribe
- Mute
- Subscribe to RSS Feed
- Permalink
- Report Inappropriate Content
Break in Straight table after field change
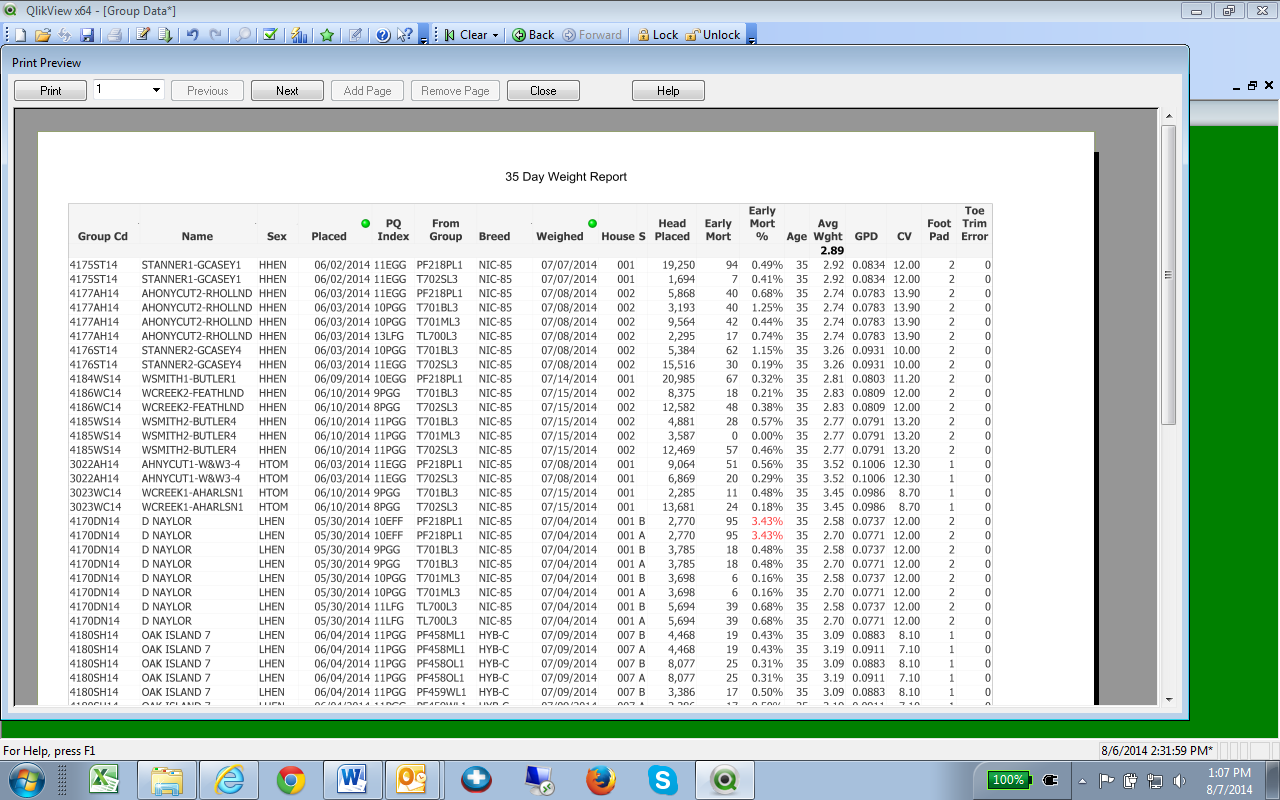
I am wondering if there is a way to create a line break in a straight table after a field changes. For example in the table above I would like to have a space appear each time the Group Cd field changes to help the user separate them. Any help on this will be greatly appreciated.
- Tags:
- new_to_qlikview
Accepted Solutions
- Mark as New
- Bookmark
- Subscribe
- Mute
- Subscribe to RSS Feed
- Permalink
- Report Inappropriate Content
You can use the Dimension Limits "Show Total" option (on the Name field) to create a subtotal line at each change of Group Cd. Then next step would be to make the subtotal text invisible so it looks just like a separator. You can make the text invisible either by:
1. Use Custom Format Cell.
2. Add the following Text Color expression to each Dimension and Expression.
=if(Dimensionality()=1,argb(0,0,0,0))
See attached example.
-Rob
- Mark as New
- Bookmark
- Subscribe
- Mute
- Subscribe to RSS Feed
- Permalink
- Report Inappropriate Content
Rob,
That's perfect, thanks.
- Mark as New
- Bookmark
- Subscribe
- Mute
- Subscribe to RSS Feed
- Permalink
- Report Inappropriate Content
Rob,
If I have two levels of breaks, say at Group_Cd and on Sex it will not let me hide the expressions on Sex. Any suggestions?
- Mark as New
- Bookmark
- Subscribe
- Mute
- Subscribe to RSS Feed
- Permalink
- Report Inappropriate Content
It's probably just a matter of adjusting the dimensionality() value(s) in the color expression, Add an temporary expression "=dimensionality()" to your chart so you can see what the values are.
-Rob