Unlock a world of possibilities! Login now and discover the exclusive benefits awaiting you.
- Qlik Community
- :
- All Forums
- :
- QlikView App Dev
- :
- Bubble Chart Animation
- Subscribe to RSS Feed
- Mark Topic as New
- Mark Topic as Read
- Float this Topic for Current User
- Bookmark
- Subscribe
- Mute
- Printer Friendly Page
- Mark as New
- Bookmark
- Subscribe
- Mute
- Subscribe to RSS Feed
- Permalink
- Report Inappropriate Content
Bubble Chart Animation
I have a table with Columns as City, Year and Population Growth of City relative to previous Year. I want to create animation in bubble chart in which size of bubble represents poplation of a city corresponding to different Years. Since, I just have the population growth instead of total population till a particular year stored in the table, I would want to add the Growth number of previous years so as to give an animation with increasing bubble's size. Size of bubbles represents population, which increases with time. And different bubbles represent different cities. Please help me in writing the expression for calculating the sum of all previous years population growth dynamically during animation.
Table looks like this. Assume the population of Cities before 2001 was 0
| Year | City | Increase in Population |
|---|---|---|
| 2001 | A | 1000 |
| 2001 | B | 2000 |
| 2001 | C | 1500 |
| 2002 | A | 1500 |
| 2002 | B | 1600 |
| 2002 | C | 2000 |
| 2003 | A | 1800 |
| 2003 | B | 2500 |
| 2003 | C | 1700 |
Bubble size for City A should depict 1000 for year 2001, (1000 + 1500 = 2500) for year 2002 and so on for all cities.
Problem is, how to calculate sum of all previous years' values. PLEASE HELP....!!!!
- Tags:
- new_to_qlikview
- « Previous Replies
-
- 1
- 2
- Next Replies »
Accepted Solutions
- Mark as New
- Bookmark
- Subscribe
- Mute
- Subscribe to RSS Feed
- Permalink
- Report Inappropriate Content
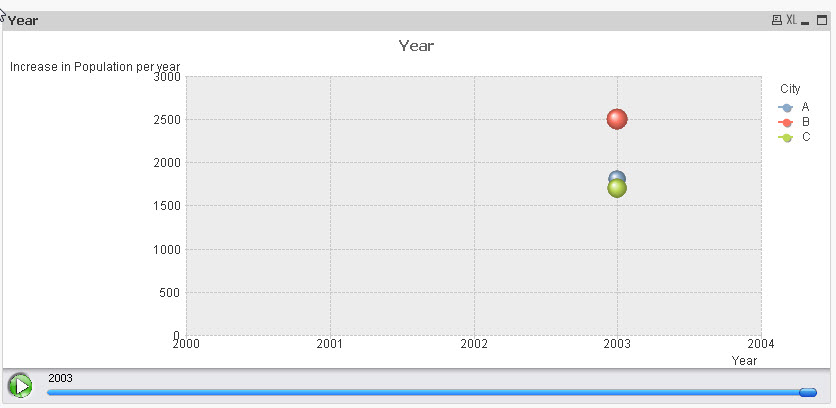
I applied the accumulation only for the bubble size as you specified.
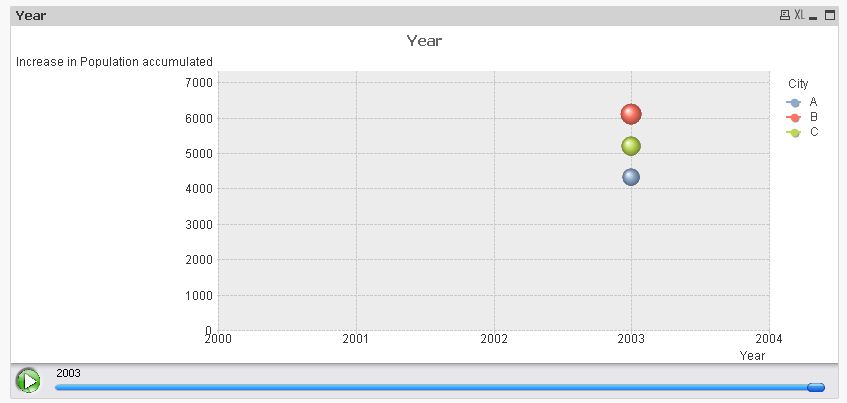
But here's another version with the accumulation checked for the y-axis also:
hope this helps
regards
Marco
- Mark as New
- Bookmark
- Subscribe
- Mute
- Subscribe to RSS Feed
- Permalink
- Report Inappropriate Content
use rangesum(above(...))
- Mark as New
- Bookmark
- Subscribe
- Mute
- Subscribe to RSS Feed
- Permalink
- Report Inappropriate Content
Nishant,
Like this????
Please see the attachment.
Thanks,
AS
- Mark as New
- Bookmark
- Subscribe
- Mute
- Subscribe to RSS Feed
- Permalink
- Report Inappropriate Content
Hi,
one possible solution using the chart accumulation function:
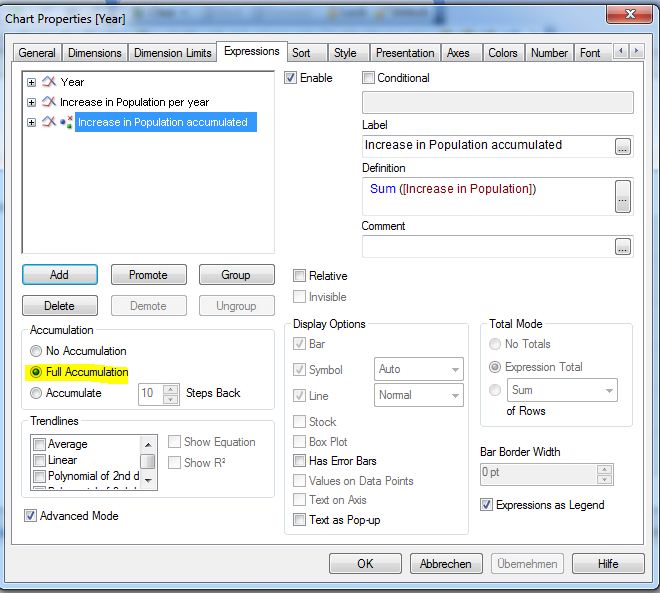
hope this helps
regards
Marco
- Mark as New
- Bookmark
- Subscribe
- Mute
- Subscribe to RSS Feed
- Permalink
- Report Inappropriate Content
Hi Marco
Thanks a lot for the help, but the solution you provided still doesn't adds up previous years' population growth. For example, according to your solution, population of City B in year 2003 is still 2500. But 2500 is just the increase in population for City B from year 2002 to 2003. Instead it should have been 2000+1600+2500 = 6100, that is, total population of City B which comes out by adding population increases for all three years.
- Mark as New
- Bookmark
- Subscribe
- Mute
- Subscribe to RSS Feed
- Permalink
- Report Inappropriate Content
Hi Amit
Thank you much for your input and yes I would like to see similar behaviour as you've done in your attached file. But I'm still not getting this behaviour. Could you please look at the attached file and let me know about my mistake. I just tried to replicate your pivot table, but couldn't get the same behaviour as yours. Thanks in advance.
- Mark as New
- Bookmark
- Subscribe
- Mute
- Subscribe to RSS Feed
- Permalink
- Report Inappropriate Content
I applied the accumulation only for the bubble size as you specified.
But here's another version with the accumulation checked for the y-axis also:
hope this helps
regards
Marco
- Mark as New
- Bookmark
- Subscribe
- Mute
- Subscribe to RSS Feed
- Permalink
- Report Inappropriate Content
Nishant,
You need to drag day to horizontal , just click on header you will get a blue vertical arrow drag it to right side and make it horizontal.
Thanks,
AS
- Mark as New
- Bookmark
- Subscribe
- Mute
- Subscribe to RSS Feed
- Permalink
- Report Inappropriate Content
Thank you so much... I got it now...:)
- Mark as New
- Bookmark
- Subscribe
- Mute
- Subscribe to RSS Feed
- Permalink
- Report Inappropriate Content
Thans a lot for your help. I got your logic now...
- « Previous Replies
-
- 1
- 2
- Next Replies »