Unlock a world of possibilities! Login now and discover the exclusive benefits awaiting you.
- Qlik Community
- :
- All Forums
- :
- QlikView App Dev
- :
- Re: Bubble/Scatter plot with a million data points...
- Subscribe to RSS Feed
- Mark Topic as New
- Mark Topic as Read
- Float this Topic for Current User
- Bookmark
- Subscribe
- Mute
- Printer Friendly Page
- Mark as New
- Bookmark
- Subscribe
- Mute
- Subscribe to RSS Feed
- Permalink
- Report Inappropriate Content
Bubble/Scatter plot with a million data points?
Hi -
I'm new to QlikView and trying to use it to plot equity trading data. I would like to see time on the x-axis and price on the y-axis. I also need different colors depending on whether the data point is for a bid or an ask. The data points have size associated with them, so I would like to plot larger bubbles for larger sizes if possible.
I have a few questions:
- Should I be using a grid or a bubble chart for this?
- Are there any constraints on the data types that can be used on each axis? With the grid chart, my time dimension plots correctly. With a scatter plot, I think I need to use row number as the dimension since I want a point for each row but this results in all times being "0".
- Is there a limit on the number of data points that QlikView can render or have people witnessed degraded performance at certain points? The underlying data is only 50 MB, but while I was trying to do this QlikView's memory footprint ranged from 2 to 6 GB and it became unresponsive.
Any help would be greatly appreciated!
Thanks!
-Andy
- Mark as New
- Bookmark
- Subscribe
- Mute
- Subscribe to RSS Feed
- Permalink
- Report Inappropriate Content
Hi Andy,
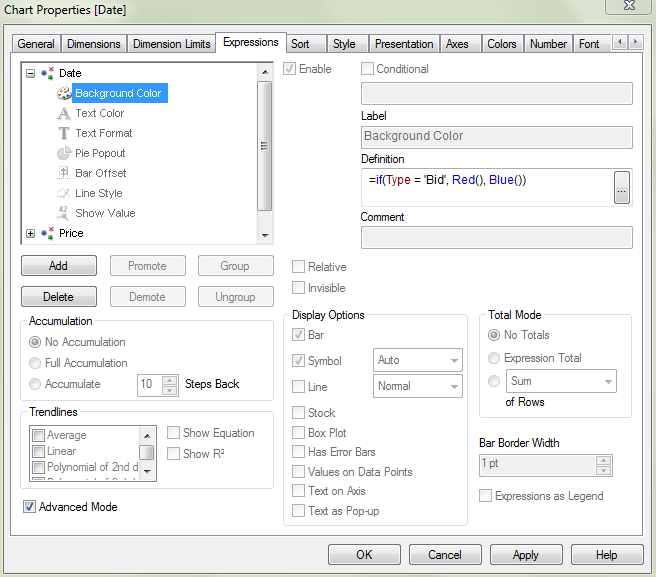
You should use a scatter plot for this. I've create a quick example attached. One little trick, to make the bubbles different colours for trades and bids you needs to set this in the expression colour (image attached of where this is the the properties). There is no limit of the number points Qlikview can plot however this will be constrained by the power of you machine (note in a deployment the constraint is the server not the client machine). You may want to consider limiting the time frame plotted or setting up a drill down if that makes sense for your use case.
-Josh