Unlock a world of possibilities! Login now and discover the exclusive benefits awaiting you.
- Qlik Community
- :
- All Forums
- :
- QlikView App Dev
- :
- Re: Bubble chart/Scatter chart with category field...
- Subscribe to RSS Feed
- Mark Topic as New
- Mark Topic as Read
- Float this Topic for Current User
- Bookmark
- Subscribe
- Mute
- Printer Friendly Page
- Mark as New
- Bookmark
- Subscribe
- Mute
- Subscribe to RSS Feed
- Permalink
- Report Inappropriate Content
Bubble chart/Scatter chart with category fields
Dear all,
I’m trying to build this kind of bubble chart, that should look like this:
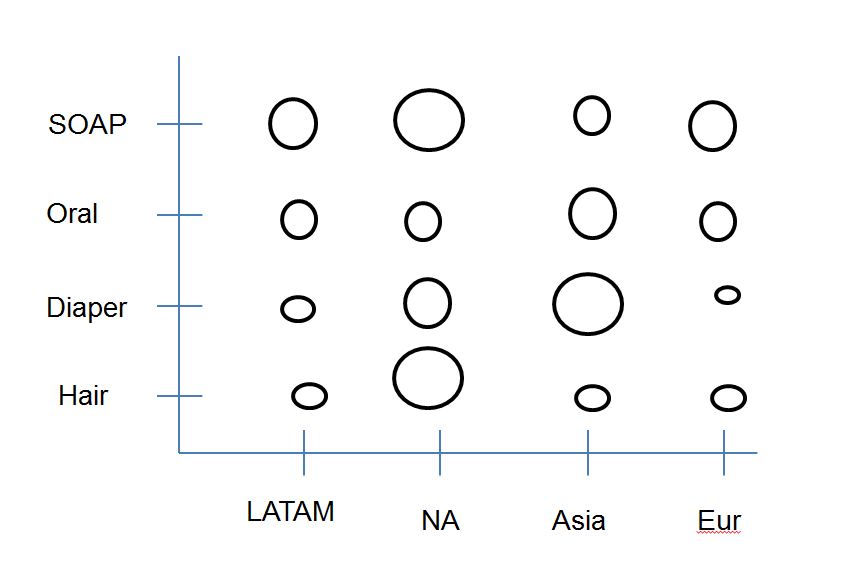
The X and Y axis are categorical fields not numeric.
I’m trying to introduce bubble size, where size depends on ‘Total sample’.
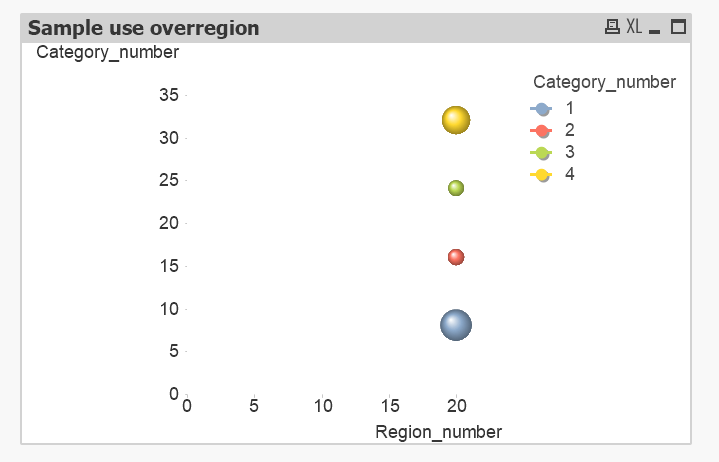
QV does not accept text field, but replacing by number may be seen as an option.
However, after loading of data in QV and build scatter chart, field number Region and Category are added together. Not something what I’m looking for, how can solve this or there are simply limitations?
Thank you and best regards,
Cornelis
Accepted Solutions
- Mark as New
- Bookmark
- Subscribe
- Mute
- Subscribe to RSS Feed
- Permalink
- Report Inappropriate Content
- Mark as New
- Bookmark
- Subscribe
- Mute
- Subscribe to RSS Feed
- Permalink
- Report Inappropriate Content
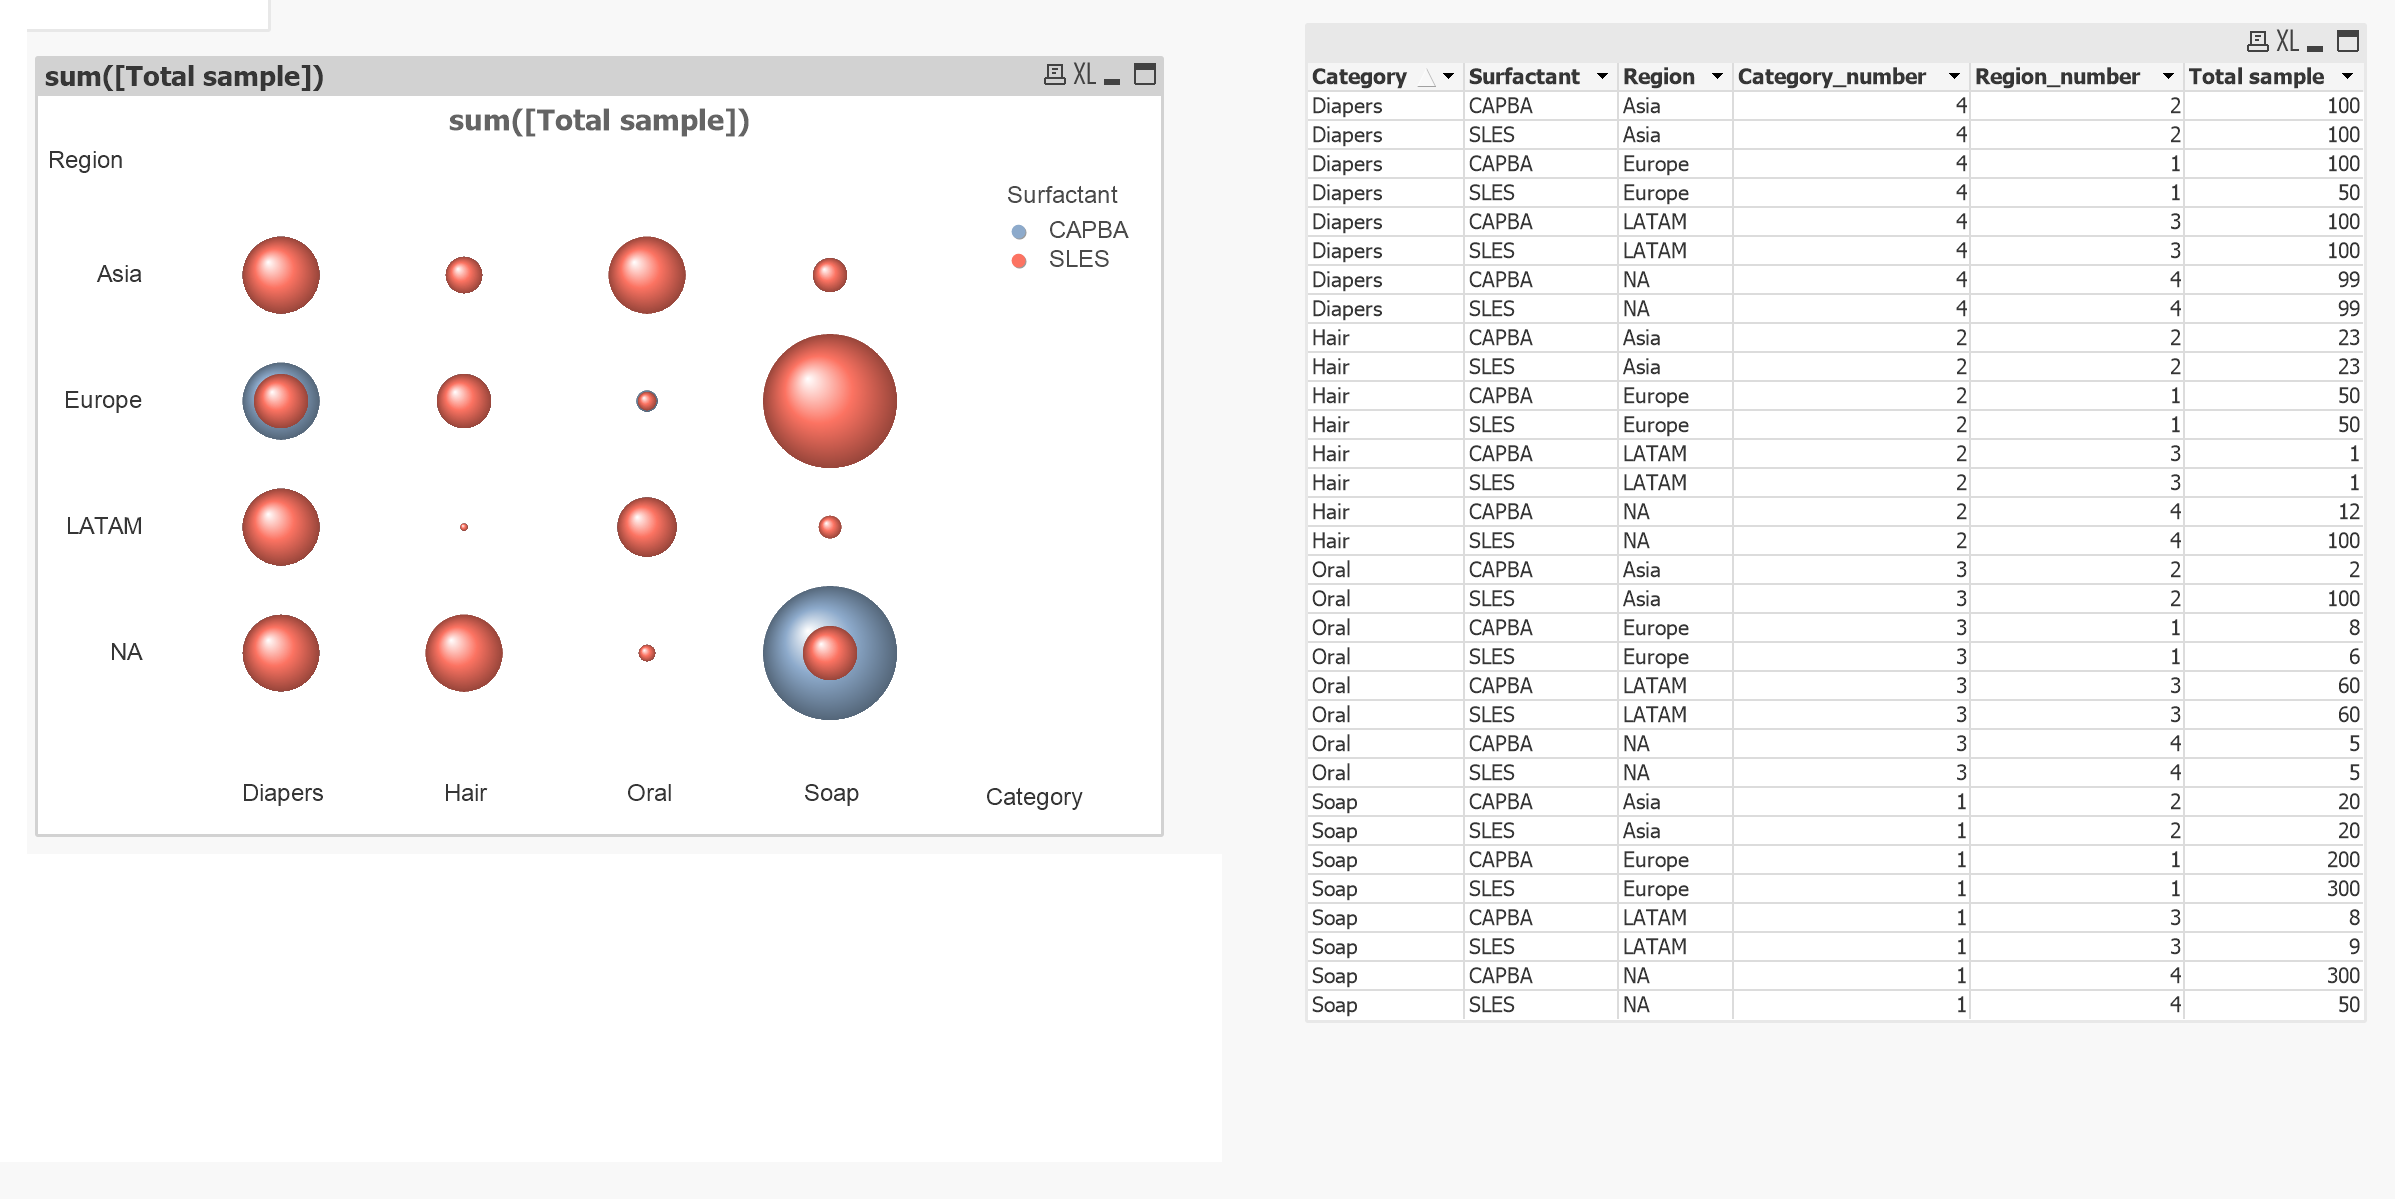
Is this you need?
- Mark as New
- Bookmark
- Subscribe
- Mute
- Subscribe to RSS Feed
- Permalink
- Report Inappropriate Content
You might want to use a grid chart instead of a scatter chart ...
- Mark as New
- Bookmark
- Subscribe
- Mute
- Subscribe to RSS Feed
- Permalink
- Report Inappropriate Content
Dear Enrique,
Ah, yes!
Grid chart is the best, not scatter chart.
Thank you for your kind support and also for Marco Wedel.
Best regards,
Cornelis