Unlock a world of possibilities! Login now and discover the exclusive benefits awaiting you.
- Qlik Community
- :
- All Forums
- :
- QlikView App Dev
- :
- Bucket Data Multiple Expression
- Subscribe to RSS Feed
- Mark Topic as New
- Mark Topic as Read
- Float this Topic for Current User
- Bookmark
- Subscribe
- Mute
- Printer Friendly Page
- Mark as New
- Bookmark
- Subscribe
- Mute
- Subscribe to RSS Feed
- Permalink
- Report Inappropriate Content
Bucket Data Multiple Expression
Hello Every one,
I am trying to do Bucketing on multiple expression.
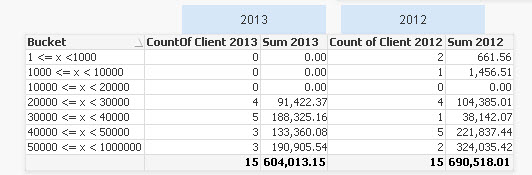
Please see below table. Count and Sum of revenue has other set conditions in the expressions.
| 2013 | 2012 | |||
| Bucket | Count | Sum Of rev | Count | Sum Of rev |
| >10MM | 3 | 32 | 5 | 55 |
| > 5MM | 5 | 30 | 3 | 16 |
| >1MM | 4 | 4.8 | 4 | 4.5 |
| <100K | 2 | 1 | 2 | 1 |
| <20K | 1 | 0.1 | 1 | 0.2 |
| Total | 15 | 67.9 | 15 | 76.7 |
Count: No of Clients who has revenue >10MM in first row for 2013 and 2012
Sum Of rev: Sum of Revenue of 3 Client in first row for 2013 and 2012
I have little idea as under
1. Use class function but don't know how to use with multiple expressions like count ans sum
2. If condition for each expression, which will be very complex.
Please help with your ideas. I tried looking in forum but could not find something like this.
I am not sure if this is possible simple way
Thank you in advance.
Dev
- Tags:
- expression
- Mark as New
- Bookmark
- Subscribe
- Mute
- Subscribe to RSS Feed
- Permalink
- Report Inappropriate Content
Any Help please
- Mark as New
- Bookmark
- Subscribe
- Mute
- Subscribe to RSS Feed
- Permalink
- Report Inappropriate Content
Please read these two documents:
- QlikCommunity Tip: How to get answers to your post?
- Preparing examples for Upload - Reduction and Data Scrambling.
talk is cheap, supply exceeds demand
- Mark as New
- Bookmark
- Subscribe
- Mute
- Subscribe to RSS Feed
- Permalink
- Report Inappropriate Content
Hi G Wassenaar
Please see attached sample data and qvw and expected output file. I am not getting expected output for revenue. The counts are coming correctly.
Hope this helps
Thank you for the feedback
Dev
- Mark as New
- Bookmark
- Subscribe
- Mute
- Subscribe to RSS Feed
- Permalink
- Report Inappropriate Content
Hi Dev
I made modification to your formula in 2013/2012 charts SumOf Rev column. I also added text object with formula.
Hope this is what you are looking for.
- Mark as New
- Bookmark
- Subscribe
- Mute
- Subscribe to RSS Feed
- Permalink
- Report Inappropriate Content
Devang,
Thank you so much. That is correct result.
Is there a Dynamic way I can get 2012 and 2013 in one chart?
- Mark as New
- Bookmark
- Subscribe
- Mute
- Subscribe to RSS Feed
- Permalink
- Report Inappropriate Content
Hi Dev
Do Something like this. Hope this help