Unlock a world of possibilities! Login now and discover the exclusive benefits awaiting you.
- Qlik Community
- :
- All Forums
- :
- QlikView App Dev
- :
- Bug in Line Chart(area style) when data is 0
- Subscribe to RSS Feed
- Mark Topic as New
- Mark Topic as Read
- Float this Topic for Current User
- Bookmark
- Subscribe
- Mute
- Printer Friendly Page
- Mark as New
- Bookmark
- Subscribe
- Mute
- Subscribe to RSS Feed
- Permalink
- Report Inappropriate Content
Bug in Line Chart(area style) when data is 0
Hi everyone,
I met a problem when using the line chart(area style), I also saw some threads talking about this problem, but I don't know whether the bug is fixed or not.
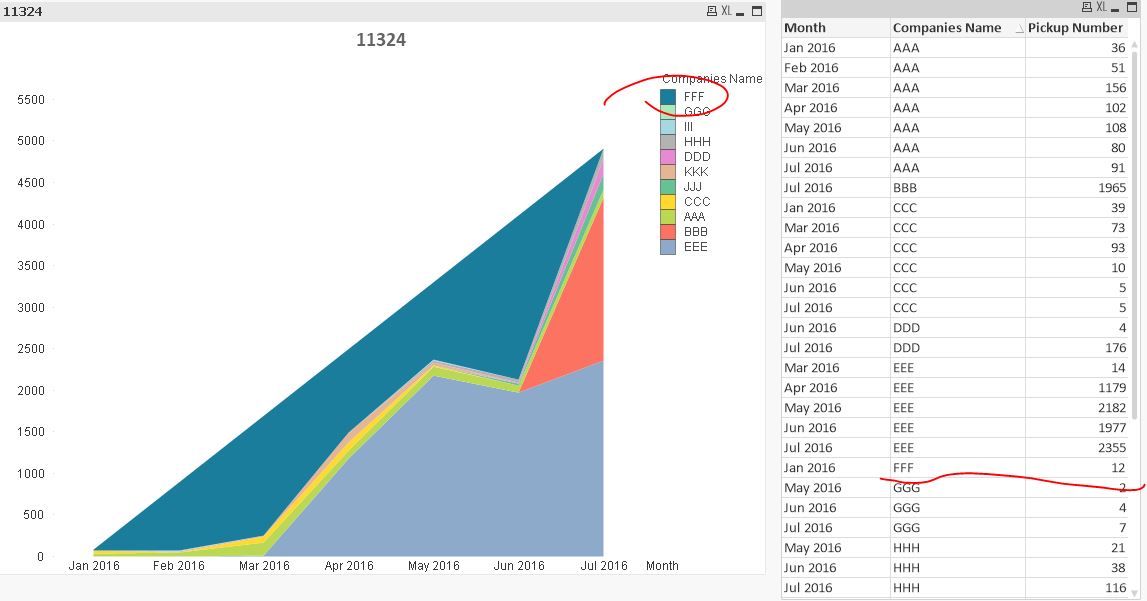
You can see that for FFF, FFF only have Jan 2016 data, but in the line chart, it shows wrong.
I think it should be :
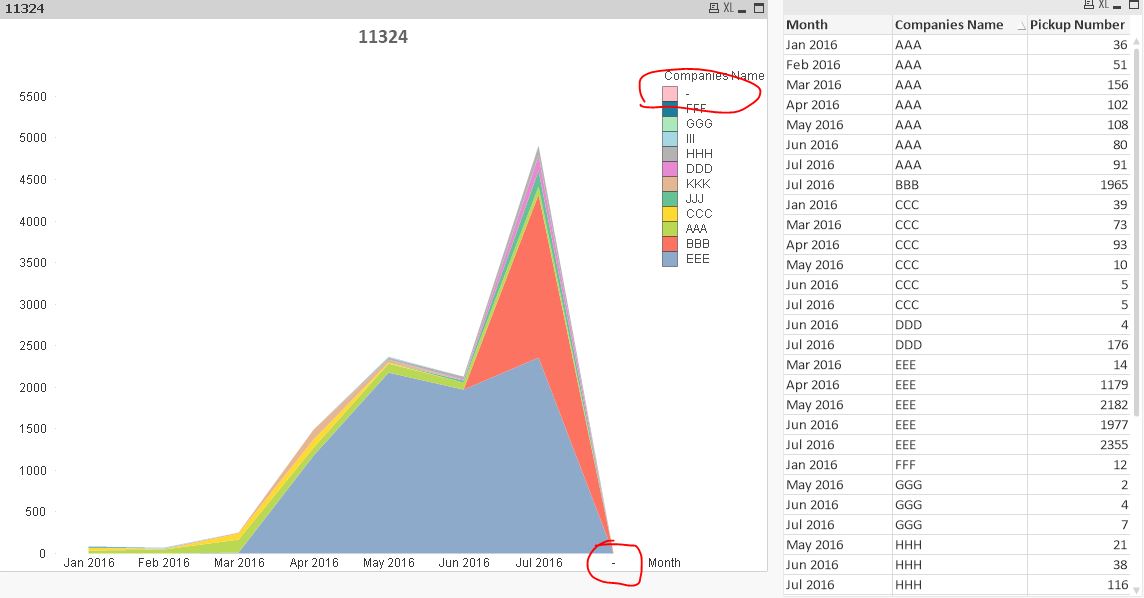
But it shouldn't show null value in Month and Companies. I tried many methods but I can't show it like what I want.
Could you please help with that?
Thanks.
Aiolos Zhao
P.S.:
- Mark as New
- Bookmark
- Subscribe
- Mute
- Subscribe to RSS Feed
- Permalink
- Report Inappropriate Content
Please check your excel file for null and zero values not showing in the qvw file.
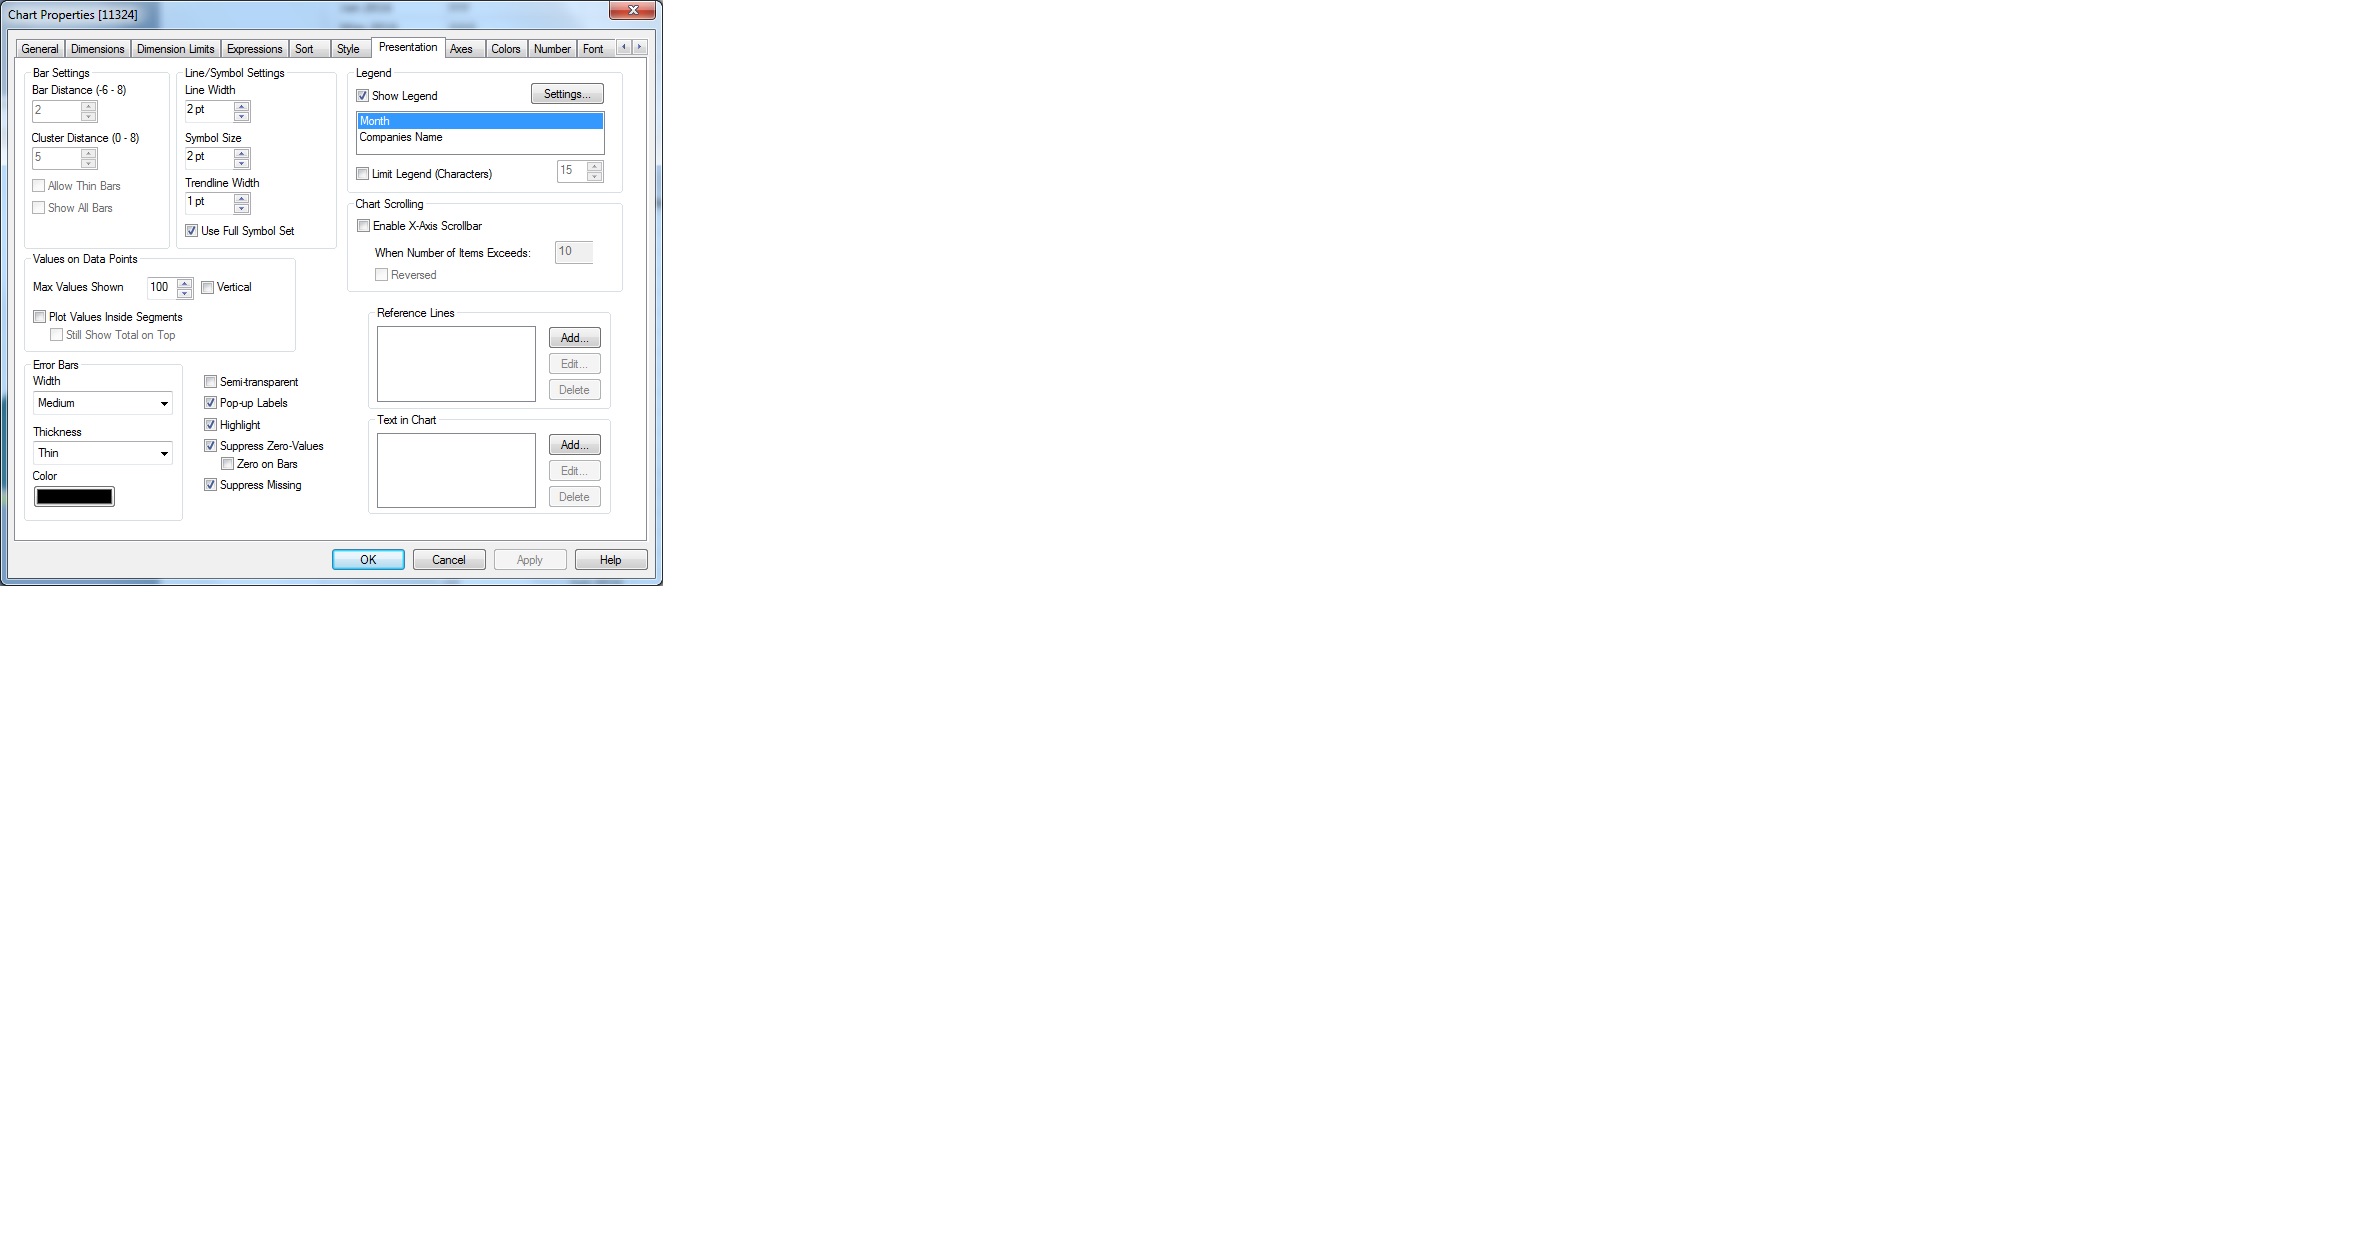
When I do supress zero values everything is OK.
HTH
André Gomes
- Mark as New
- Bookmark
- Subscribe
- Mute
- Subscribe to RSS Feed
- Permalink
- Report Inappropriate Content
or else
you can check suppress when value is null in dimension tab aswell
- Mark as New
- Bookmark
- Subscribe
- Mute
- Subscribe to RSS Feed
- Permalink
- Report Inappropriate Content
Thanks for reply and you can use my example qvw, if you suppress zero value, it will shows wrong like the first graph.
- Mark as New
- Bookmark
- Subscribe
- Mute
- Subscribe to RSS Feed
- Permalink
- Report Inappropriate Content
Thanks for reply, I know in dimension tab there is a suppress when value is null checkbox, but if I check that, it will shows wrong graph, you can try it using my example qvw.