Unlock a world of possibilities! Login now and discover the exclusive benefits awaiting you.
- Qlik Community
- :
- All Forums
- :
- QlikView App Dev
- :
- Re: Building Chart with mentioned functionality
- Subscribe to RSS Feed
- Mark Topic as New
- Mark Topic as Read
- Float this Topic for Current User
- Bookmark
- Subscribe
- Mute
- Printer Friendly Page
- Mark as New
- Bookmark
- Subscribe
- Mute
- Subscribe to RSS Feed
- Permalink
- Report Inappropriate Content
Building Chart with mentioned functionality
Hi,
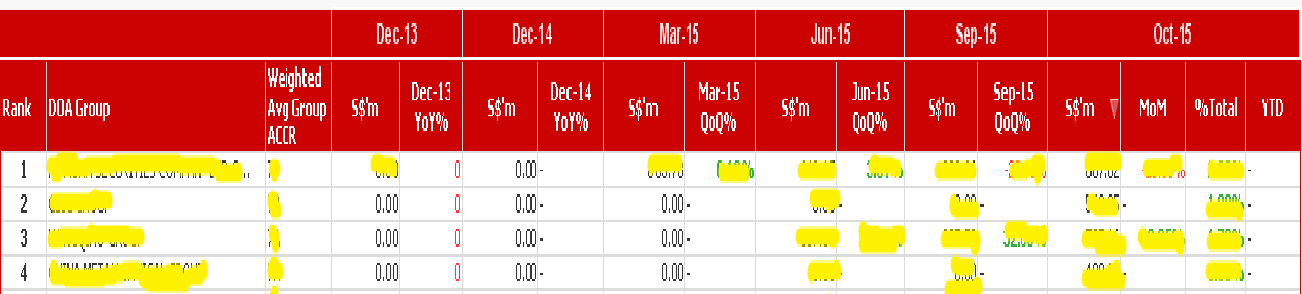
I need help in building below chart which has functionality if click on any expression value then the data should get filtered out by dimensions in chart (DOA Group & Weighted Avg Group AcCR) + Month for which that value is selected.
Expressions are calculated by month dates which are dynamic if current month is Oct-15 Then Previous Quarter Month of the Current Month (Sep-15), Previous 2nd Quarter Month(Jun-15), Previous 3rd Quarter Month (Mar-15), Previous Year (Dec-14) is the logic to calculate these dates And Previous 2nd Year (Dec-13) (From right to left). My client want to have functionality if click on any expression value then the data should get filtered out by dimensions in chart (DOA Group & Weighted Avg Group AcCR) + Month for which that value is selected. I have populated these dates using variables & used set analysis in expressions.
I tried using pivot table, used month as one of the dimensions and dragged it to column but here issue is its giving me all the month which i don't want . If i use valuelist that functionality of filtering data by dimension and selected value month disappears.
This table has other expressions also QoQ & YoY . How to build this kind of chart with mentioned functionality. Please help.
- Mark as New
- Bookmark
- Subscribe
- Mute
- Subscribe to RSS Feed
- Permalink
- Report Inappropriate Content
QlikView does not implement selections based on expression values.
Qlik Sense does