Unlock a world of possibilities! Login now and discover the exclusive benefits awaiting you.
- Qlik Community
- :
- All Forums
- :
- QlikView App Dev
- :
- Re: Calculate cummulative percentage of the SAL
- Subscribe to RSS Feed
- Mark Topic as New
- Mark Topic as Read
- Float this Topic for Current User
- Bookmark
- Subscribe
- Mute
- Printer Friendly Page
- Mark as New
- Bookmark
- Subscribe
- Mute
- Subscribe to RSS Feed
- Permalink
- Report Inappropriate Content
Calculate cummulative percentage of the SAL
Hi All,
There are two sheets in the application.
First sheet tells about SAL,COMM,COMM/SAL,Cummulative SAL,Cummulative COMM,Cummulative COMM/Cummulative SAL (Cummulative %) .
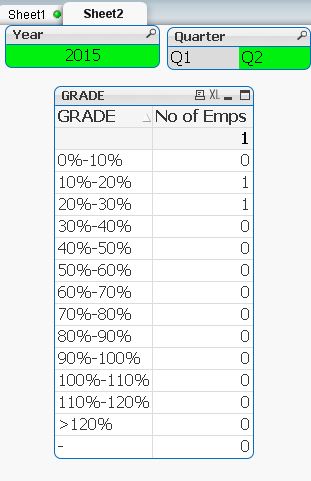
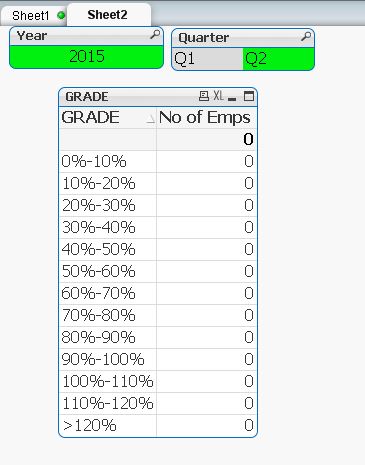
Second sheet tells about distinct count of employees on GRADE wise (Percentage Grade).
Sheet1 selection:
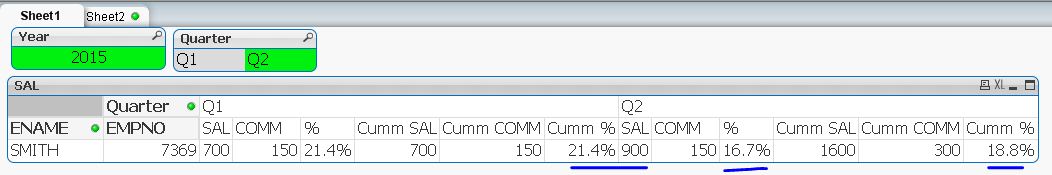
Cumm % is 18.8% when I select 2015,Q2. But in sheet2 it is showing 2 records GRADE 10%-20% and 20%-30%. These two are Q1 and Q2 values. I want to show 10%-20% as Cumm % is 18.8%.
Sheet2 selection:
Please help me.
Accepted Solutions
- Mark as New
- Bookmark
- Subscribe
- Mute
- Subscribe to RSS Feed
- Permalink
- Report Inappropriate Content
Hi,
Please find attached file for solution, I did this only for 0-10% and 10-20%, you can implement the same for remaining.
Regards,
Jagan.
- Mark as New
- Bookmark
- Subscribe
- Mute
- Subscribe to RSS Feed
- Permalink
- Report Inappropriate Content
Please help.
- Mark as New
- Bookmark
- Subscribe
- Mute
- Subscribe to RSS Feed
- Permalink
- Report Inappropriate Content
Hi,
For this you should calculate in the Front end for this chart.
Regards,
Jagan.
- Mark as New
- Bookmark
- Subscribe
- Mute
- Subscribe to RSS Feed
- Permalink
- Report Inappropriate Content
Try this by creating a synthetic dimension using ValueList() and calculate the same in the front end.
Formatted Report Type Chart using Valuelist
Synthetic Dimensions - ValueList() (Example)
Regards,
jagan.
- Mark as New
- Bookmark
- Subscribe
- Mute
- Subscribe to RSS Feed
- Permalink
- Report Inappropriate Content
Hi,
PFA file for solution.
Regards,
Jagan.
- Mark as New
- Bookmark
- Subscribe
- Mute
- Subscribe to RSS Feed
- Permalink
- Report Inappropriate Content
Hi Jagan,
For SMITH, Q2 - No of Emps value is showing zero values.
Kindly help.
- Mark as New
- Bookmark
- Subscribe
- Mute
- Subscribe to RSS Feed
- Permalink
- Report Inappropriate Content
Create a Pivot or Straight Table
Your Dimension
Expression
1)
SUM([No Clts])
2) Cumm.
RangeSum(Above(Sum(Com CUmm),0,RowNo()))/SUM(TOTALCom CUmm)
Don't forget to change the 2nd expression to % Format using Number tab 🙂
- Mark as New
- Bookmark
- Subscribe
- Mute
- Subscribe to RSS Feed
- Permalink
- Report Inappropriate Content
Hi,
Refer this file, it is working correctly.
REgards,
Jagan.
- Mark as New
- Bookmark
- Subscribe
- Mute
- Subscribe to RSS Feed
- Permalink
- Report Inappropriate Content
Hi,
Please find attached file for solution, I did this only for 0-10% and 10-20%, you can implement the same for remaining.
Regards,
Jagan.
- Mark as New
- Bookmark
- Subscribe
- Mute
- Subscribe to RSS Feed
- Permalink
- Report Inappropriate Content