Unlock a world of possibilities! Login now and discover the exclusive benefits awaiting you.
- Qlik Community
- :
- All Forums
- :
- QlikView App Dev
- :
- Re: Calculate percentile of specific value
- Subscribe to RSS Feed
- Mark Topic as New
- Mark Topic as Read
- Float this Topic for Current User
- Bookmark
- Subscribe
- Mute
- Printer Friendly Page
- Mark as New
- Bookmark
- Subscribe
- Mute
- Subscribe to RSS Feed
- Permalink
- Report Inappropriate Content
Calculate percentile of specific value
Hi all,
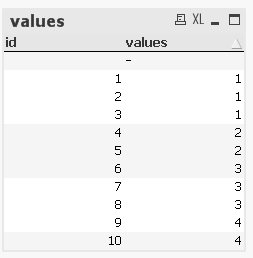
I've a table with 2 columns - id and value. See the screenshot below and attached file.
I'd like to calculate the percentile of each of the values.
For example, value = 1 should have a percentile of 0.3 (or 30%) since out of the 10 available values, the 3 lowest values are 1.
I suppose I'm actually looking for the inverse of fractile().
Does anybody know how to do this?
Thanks,
Assaf
Accepted Solutions
- Mark as New
- Bookmark
- Subscribe
- Mute
- Subscribe to RSS Feed
- Permalink
- Report Inappropriate Content
I ended up doing this:
=rank(Total - values,3)/count(Total values)
which gave the percentile of each value.
- Mark as New
- Bookmark
- Subscribe
- Mute
- Subscribe to RSS Feed
- Permalink
- Report Inappropriate Content
Maybe like
=Rangesum(Above(Count(values),0,rowno())) /Count(TOTAL values)
as expression in a chart with dimension values.
Are these the numbers you are looking for?
- Mark as New
- Bookmark
- Subscribe
- Mute
- Subscribe to RSS Feed
- Permalink
- Report Inappropriate Content
Or if you want to get the percentage for a specific selected value:
=Num(Count({<values = {"<=$(=Only(values))"}>} values) / count( {1} values),'#.00%')
- Mark as New
- Bookmark
- Subscribe
- Mute
- Subscribe to RSS Feed
- Permalink
- Report Inappropriate Content
I ended up doing this:
=rank(Total - values,3)/count(Total values)
which gave the percentile of each value.
- Mark as New
- Bookmark
- Subscribe
- Mute
- Subscribe to RSS Feed
- Permalink
- Report Inappropriate Content
Hello,
I need to calculate the 80th percentile per month for a set of data. do you have an idea how I can do that in a chart expression?
Thank you,