Unlock a world of possibilities! Login now and discover the exclusive benefits awaiting you.
- Qlik Community
- :
- All Forums
- :
- QlikView App Dev
- :
- Calculate sales for previous year
- Subscribe to RSS Feed
- Mark Topic as New
- Mark Topic as Read
- Float this Topic for Current User
- Bookmark
- Subscribe
- Mute
- Printer Friendly Page
- Mark as New
- Bookmark
- Subscribe
- Mute
- Subscribe to RSS Feed
- Permalink
- Report Inappropriate Content
Calculate sales for previous year
Hi!
I wan't to use year as dimension and calculate the sales for the previous year. How do I do this if I wan't to view 4 years at the same time? Like this:
| Year | Sales |
|---|---|
| 2014 | Sales for 2013 |
| 2013 | Sales for 2012 |
| 2012 | Sales for 2011 |
| 2011 | Sales for 2010 |
How do I do this in the easiest way?
Thanks in advance!
- Mark as New
- Bookmark
- Subscribe
- Mute
- Subscribe to RSS Feed
- Permalink
- Report Inappropriate Content
If you have a date for sales for example sale_date then when you load your sales data add a field year(sale_date) as year, in this way simply doing a sum of sales values in the expression (using year as dimension) you will have whqat you need
Let me know
- Mark as New
- Bookmark
- Subscribe
- Mute
- Subscribe to RSS Feed
- Permalink
- Report Inappropriate Content
Its seems like rolling 4 years from current year. Work on the rolling years.
- Mark as New
- Bookmark
- Subscribe
- Mute
- Subscribe to RSS Feed
- Permalink
- Report Inappropriate Content
you have many ways to achieve that depending on your data model, you can prepare the previous sales in the script using the peek function on each year to peek the sales of the previous year.
you can do that from the chart using set analysis, where you will define a variable called vPreviousYear which is the selected year - 1 and use it when calculating the sales of this year, or if the years are sorted you can use the below function to get the sales of the below row for example the below sales for year 2014 will return the sales of 2013.
- Mark as New
- Bookmark
- Subscribe
- Mute
- Subscribe to RSS Feed
- Permalink
- Report Inappropriate Content
If you want to showcase the data in table format , see the attachment.
- Mark as New
- Bookmark
- Subscribe
- Mute
- Subscribe to RSS Feed
- Permalink
- Report Inappropriate Content
Hi Kim,
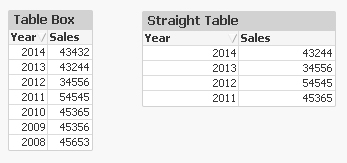
Easiest way of solve this problem would be i explain with an example see the inline table here i take 7 years sales data
and in the front end i take the straight table
LOAD * INLINE [
Year, Sales
2014, 43432
2013, 43244
2012, 34556
2011, 54545
2010, 45365
2009, 45356
2008, 45653
];
1.Straight table with dimension and expression
Dimension:- Year+1
Expression:- sum({<Year= { '>=$(=max(Year)-4) <=$(=max(Year)-1) '}>} Sales)
Note:- As you describe you need the data as and this chart is dynamic when you select 2012 year this will gives last 4 years data.
| Year | Sales |
|---|---|
| 2014 | Sales for 2013 |
| 2013 | Sales for 2012 |
| 2012 | Sales for 2011 |
| 2011 | Sales for 2010 |
And then in the straight table you get data as mention above

Regards
- Mark as New
- Bookmark
- Subscribe
- Mute
- Subscribe to RSS Feed
- Permalink
- Report Inappropriate Content
Thanks for your reply.
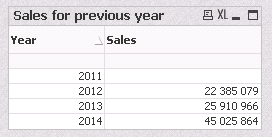
I tried using the above-funktion but it returns null for the first year, which is correct but I wan't to hide this row, is that possible?

- Mark as New
- Bookmark
- Subscribe
- Mute
- Subscribe to RSS Feed
- Permalink
- Report Inappropriate Content
Check (in the presentation tab) the box "suppress zero values"
- Mark as New
- Bookmark
- Subscribe
- Mute
- Subscribe to RSS Feed
- Permalink
- Report Inappropriate Content
Tried that, didn't help I'm afraid.
- Mark as New
- Bookmark
- Subscribe
- Mute
- Subscribe to RSS Feed
- Permalink
- Report Inappropriate Content
Could you attach your document?