Unlock a world of possibilities! Login now and discover the exclusive benefits awaiting you.
- Qlik Community
- :
- All Forums
- :
- QlikView App Dev
- :
- Calculate the Chart expression value based on inpu...
- Subscribe to RSS Feed
- Mark Topic as New
- Mark Topic as Read
- Float this Topic for Current User
- Bookmark
- Subscribe
- Mute
- Printer Friendly Page
- Mark as New
- Bookmark
- Subscribe
- Mute
- Subscribe to RSS Feed
- Permalink
- Report Inappropriate Content
Calculate the Chart expression value based on input value
Hi all,
I am trying to calculate productivity of the manpower based on shift using bar chart. However, i would like use to input box to input the number of people in each shift.
Example:
Data:
| Part | Shift | Event |
| A | 1 | Finished |
| B | 1 | Finished |
| C | 1 | Finished |
| D | 1 | Finished |
| E | 2 | Finished |
| F | 2 | Finished |
| G | 2 | Finished |
| H | 2 | Finished |
| I | 2 | Finished |
| J | 2 | Finished |
Input Box Variables:
| Variables | Variable Value |
|---|---|
| Number of 1st shift people | 5 |
| Number of 2nd shift people | 3 |
So,
Productivity of 1st shift people based on finished event time = 3/5 (number of finished events/number of people in 1st shift)
Productivity of 2nd shift people based on finished event time = 5/3 (number of finished events/number of people in 1st shift)
How do i calcuate this in expression because my number of people in shift changes everyday.
Thanks,
Vidya
- « Previous Replies
-
- 1
- 2
- Next Replies »
- Mark as New
- Bookmark
- Subscribe
- Mute
- Subscribe to RSS Feed
- Permalink
- Report Inappropriate Content
Hi Vidya,
vNoOfPeopleShift1 = data coming from input box
vNoOfPeopleShift2 = data coming from input box
Productivity of 1 shift = count({<Event = {'Finished'},shift = {1}>}Part)/$(vNoOfPeopleShift1)
Productivity of 2 shift = count({<Event = {'Finished'},shift = {2}>}Part)/$(vNoOfPeopleShift2)
Regards,
Akshaya
- Mark as New
- Bookmark
- Subscribe
- Mute
- Subscribe to RSS Feed
- Permalink
- Report Inappropriate Content
Hi Akshay,
Can this be achieved in one single expression? I want both expressions to be in one.
Thanks,
Vidya
- Mark as New
- Bookmark
- Subscribe
- Mute
- Subscribe to RSS Feed
- Permalink
- Report Inappropriate Content
Hi Vidya,
We can do it one expression but can you help me to understand the use case. If you can tell me what exactly be the end result for you, I can write in one.
Regards,
Akshaya
- Mark as New
- Bookmark
- Subscribe
- Mute
- Subscribe to RSS Feed
- Permalink
- Report Inappropriate Content
How did you get Number 3 for 1st Shift people? I mean number of finished events based on data you provided?
- Mark as New
- Bookmark
- Subscribe
- Mute
- Subscribe to RSS Feed
- Permalink
- Report Inappropriate Content
Hi Akshay,
I want to display these results in one stacked bar chart showing productivity efficiency of the man power.
My dimensions are Date, Shift (i did not include date in the example data i gave)
My Measure is Productivity Efficiency.
Here is Sample: (Ignore numbers)
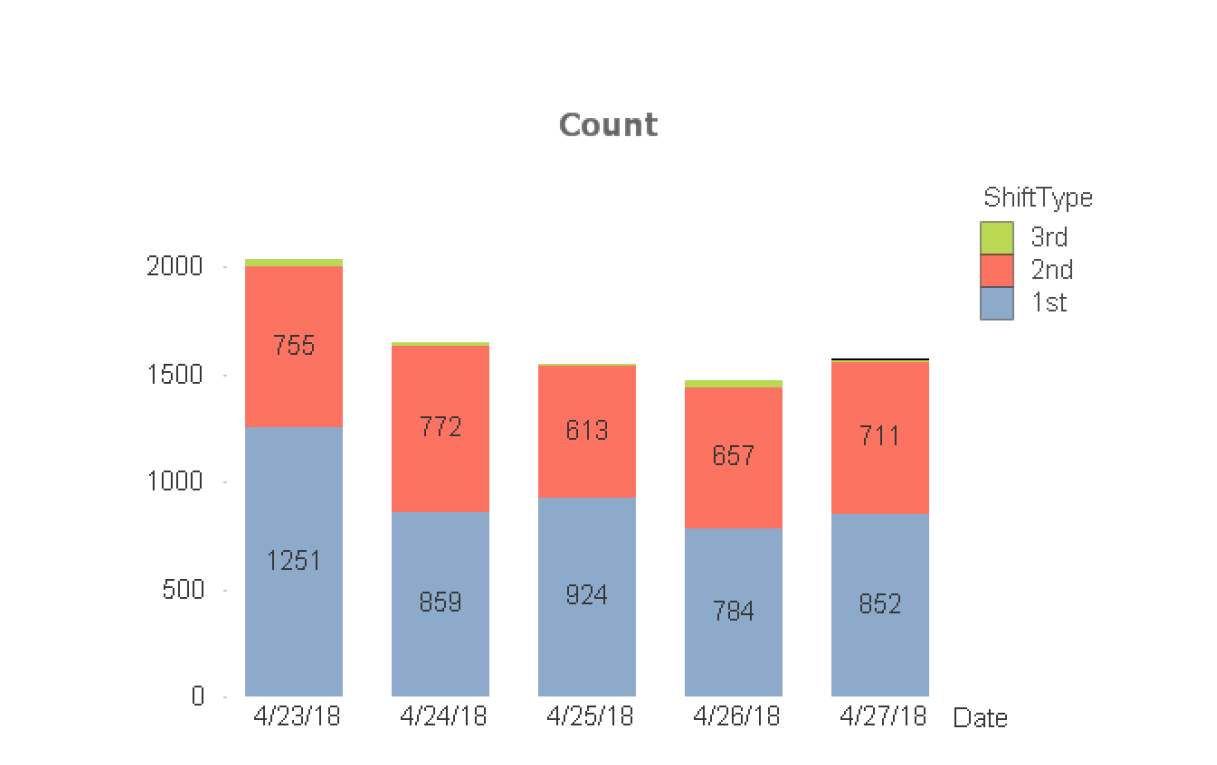
Let me know if this makes sense.
Thanks,
Vidya
- Mark as New
- Bookmark
- Subscribe
- Mute
- Subscribe to RSS Feed
- Permalink
- Report Inappropriate Content
Hi Vishwarath,
Yes, it is the number of finished events for each shift.
Thanks,
Vidya
- Mark as New
- Bookmark
- Subscribe
- Mute
- Subscribe to RSS Feed
- Permalink
- Report Inappropriate Content
We need more data to work on. can you share a sample file to look into?
- Mark as New
- Bookmark
- Subscribe
- Mute
- Subscribe to RSS Feed
- Permalink
- Report Inappropriate Content
Here is data:
| Part | Date | Event | Shift |
| A | 5/3/2018 | Finished | 1 |
| B | 5/3/2018 | Finished | 1 |
| C | 5/3/2018 | Started | 1 |
| D | 5/3/2018 | Finished | 2 |
| E | 5/3/2018 | Finished | 2 |
| F | 5/3/2018 | Finished | 2 |
| G | 5/3/2018 | Finished | 2 |
| H | 5/3/2018 | Finished | 2 |
| I | 5/2/2018 | Started | 1 |
| J | 5/2/2018 | Finished | 1 |
| K | 5/2/2018 | Finished | 2 |
| L | 5/2/2018 | Finished | 2 |
| M | 5/2/2018 | Finished | 2 |
| N | 5/1/2018 | Finished | 1 |
| O | 5/1/2018 | Finished | 1 |
| P | 5/1/2018 | Finished | 1 |
| Q | 5/1/2018 | Finished | 2 |
| R | 5/1/2018 | Finished | 2 |
| S | 5/1/2018 | Finished | 2 |
| T | 5/1/2018 | Finished | 2 |
Variables:
| Variables | Variable Value |
|---|---|
| Number of 1st shift people | 5 |
| Number of 2nd shift people | 3 |
Let me know if this helps
THanks,
Vidya
- Mark as New
- Bookmark
- Subscribe
- Mute
- Subscribe to RSS Feed
- Permalink
- Report Inappropriate Content
Hi Vidya,
Please find below the expression for your chart.
if(Shift = '1st',count({<Event = {'Finished'}>}Part)/$(vNoOfPeopleShift1),
if(Shift = '2nd',count({<Event = {'Finished'}>}Part)/$(vNoOfPeopleShift2),
count({<Event = {'Finished'}>}Part)/$(vNoOfPeopleShift3)))
Here above you have to create 3 variables for three shift
vNoOfPeopleShift1, vNoOfPeopleShift2, vNoOfPeopleShift3
Regards,
Akshaya
PS - If you find this response correct, mark it as correct.
- « Previous Replies
-
- 1
- 2
- Next Replies »