Unlock a world of possibilities! Login now and discover the exclusive benefits awaiting you.
- Qlik Community
- :
- All Forums
- :
- QlikView App Dev
- :
- Calculate the Median from all above values in a ch...
- Subscribe to RSS Feed
- Mark Topic as New
- Mark Topic as Read
- Float this Topic for Current User
- Bookmark
- Subscribe
- Mute
- Printer Friendly Page
- Mark as New
- Bookmark
- Subscribe
- Mute
- Subscribe to RSS Feed
- Permalink
- Report Inappropriate Content
Calculate the Median from all above values in a chart
Hello,
i'm new to qlikview and have a problem to calculate the median.
Here ist my example
| DAT1 | Value1 | Median1 |
| 01.01.2013 | 2 | 2 |
| 02.01.2013 | 5 | 3,5 |
| 03.01.2013 | 3 | 3 |
| 04.01.2013 | 7 | 4 |
| 05.01.2013 | 8 | 5 |
| 06.01.2013 | 1 | 4 |
| 07.01.2013 | 2 | 3 |
| 08.01.2013 | 8 | 4 |
| 09.01.2013 | 3 | 3 |
| 10.01.2013 | 2 | 3 |
| 11.01.2013 | 1 | 3 |
I thought it is something like : MEDIAN( {$<DAT1={"<=MAX(DAT1)"}>} Value1 )
But it doesn't work.
Best Regards,
Achim
- Tags:
- new_to_qlikview
- Mark as New
- Bookmark
- Subscribe
- Mute
- Subscribe to RSS Feed
- Permalink
- Report Inappropriate Content
Hiii arcsturm,
No need of witing the set expression for date if you are adding date as dimention.
you can do the following thing:
1. Take date as dimention.
2. Then Add "Median(Value1)" as Expression.
For more clarification please see this:
median( [{set_expression}] [ total [<fld {,fld}>] ] expression )
Returns the aggregated median of expression iterated over the chart dimension(s).
This function has the same limitations for nested aggregation as the avg function. The median function supports sets and the total qualifier in the same way as the avgfunction.
Examples:
median( X )
median( X*Y/3 )
median( total X )
median( total <Group> Price )
-Nilesh
- Mark as New
- Bookmark
- Subscribe
- Mute
- Subscribe to RSS Feed
- Permalink
- Report Inappropriate Content
Hello Nilesh,
that doesn't work.
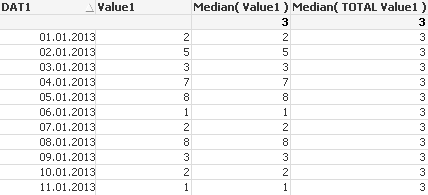
Here i have dat1 and value1 as an dimension, but median ( value1 ) is equal value1.
The median of 1.1.2013 is 2, from 2.1.2013 is 3.5, from 3.1.2013 is 3 .....
Greetings Achim
- Mark as New
- Bookmark
- Subscribe
- Mute
- Subscribe to RSS Feed
- Permalink
- Report Inappropriate Content
here is the picture of the chart