Unlock a world of possibilities! Login now and discover the exclusive benefits awaiting you.
- Qlik Community
- :
- All Forums
- :
- QlikView App Dev
- :
- Calculated Dimension issue
- Subscribe to RSS Feed
- Mark Topic as New
- Mark Topic as Read
- Float this Topic for Current User
- Bookmark
- Subscribe
- Mute
- Printer Friendly Page
- Mark as New
- Bookmark
- Subscribe
- Mute
- Subscribe to RSS Feed
- Permalink
- Report Inappropriate Content
Calculated Dimension issue
Hello,
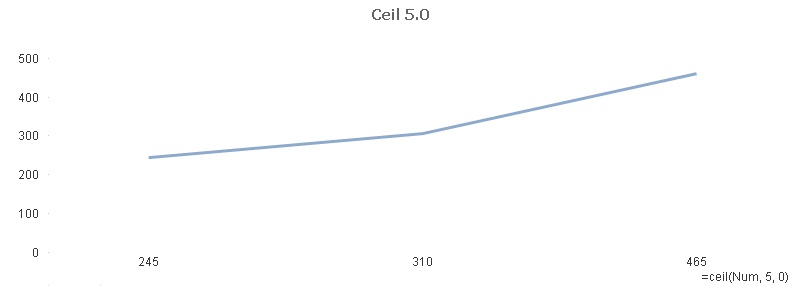
I'm trying to use a calculated dimension as my x-axis on a graph, specifically the Floor/Ceil functions. The point is to limit many observations to a more managable amount. I set Ceil(Num, 5, 0) as my calculated dimension, but Qlikveiw only returned 3 points on the x-axis. However, if I use that same formula as an expression in a straight table chart, many more unique values are returned. The goal is to use standard deviaiton, rather than '5', as the multiple in the equation, ie Ceil(Num, 0.25*Stdev(TOTAL(Num)), 0), but that did not return any values as I have it now.
There's only one field in my dataset, Num, which is a random list of 500 numbers between 0 & 500. The question is how do I get the calculated dimesion on my graph to return all the unique values I am seeing in my expression in the table?
The QVD and images are attached for reference.
Thanks in advance
- Mark as New
- Bookmark
- Subscribe
- Mute
- Subscribe to RSS Feed
- Permalink
- Report Inappropriate Content
It is because more than one Num get mapped to a ceiling like:
(2,3,4) all get mapped to the value 5
Therefore in your expression with just Num, it has 3 values it can choose from and it doesnt know which, so it becomes null. I am not sure what you are trying to do, but you need to aggregate your expression with something like:
sum(Num)
Hope this helps!
- Mark as New
- Bookmark
- Subscribe
- Mute
- Subscribe to RSS Feed
- Permalink
- Report Inappropriate Content
Jerem,
I am trying to condense the x-axis into fewer points, so rather than (2,3,4) all being mapped as 5, I need only one of those values mapped, prefereably the largest. Should I use the Max() function as my 'x' in the Ceil function?
thank you
- Mark as New
- Bookmark
- Subscribe
- Mute
- Subscribe to RSS Feed
- Permalink
- Report Inappropriate Content
Well if you just want the max Num in your expression, then you can just use max(Num) in your expression and this will just give you the max number for it.
Can you give a brief description of what exactly you are trying to accomplish? What do you want displayed for your expression when you have your calculated dimension?
- Mark as New
- Bookmark
- Subscribe
- Mute
- Subscribe to RSS Feed
- Permalink
- Report Inappropriate Content
Sure, I want just the unique values, that are a result of Ceil(Num, 5, 0) to be displayed on the x-axis. So 5, 10, 15, 20, ect as single points along the x-axis with the corresponding y-value to be the max of all possible values.
On that thought, I solved my own problem. I need to modify the expression as well as Max(Num); where's before it was just Num.
Thank you Jerem