Unlock a world of possibilities! Login now and discover the exclusive benefits awaiting you.
- Qlik Community
- :
- All Forums
- :
- QlikView App Dev
- :
- Re: Calculated Dimension
- Subscribe to RSS Feed
- Mark Topic as New
- Mark Topic as Read
- Float this Topic for Current User
- Bookmark
- Subscribe
- Mute
- Printer Friendly Page
- Mark as New
- Bookmark
- Subscribe
- Mute
- Subscribe to RSS Feed
- Permalink
- Report Inappropriate Content
Calculated Dimension
I want to create last three month data based on selected month
- Mark as New
- Bookmark
- Subscribe
- Mute
- Subscribe to RSS Feed
- Permalink
- Report Inappropriate Content
{1 < YourMonthField ={'>=$(=only(YourMonthField )-2)<=$(=only(YourMonthField ))'}>}
YourMonthField is either an internal Serial ID for a Time Dimension or your regular monthfield in a listbox.
- Mark as New
- Bookmark
- Subscribe
- Mute
- Subscribe to RSS Feed
- Permalink
- Report Inappropriate Content
brother it works perfectly as you want, when i check you don't have data for all the months that why its showing no data , to show this i have created a list box in the app please check.
- Mark as New
- Bookmark
- Subscribe
- Mute
- Subscribe to RSS Feed
- Permalink
- Report Inappropriate Content
=COUNT({1 <TRANSPORT_MODE={'AIR'} ,SHIP_YEAR={'=$(APPAC_SelectedCurrentYear)'},SHIP_MONTH ={'>=$(APPAC_SelectedMonth-2)<=$(APPAC_SelectedMonth)'}>} SHIP_NO)
AND
=COUNT({1 <TRANSPORT_MODE={'SEA'} ,SHIP_YEAR={'=$(APPAC_SelectedCurrentYear)'},SHIP_MONTH ={'>=$(APPAC_SelectedMonth-2)<=$(APPAC_SelectedMonth)'}>} SHIP_NO)
- Mark as New
- Bookmark
- Subscribe
- Mute
- Subscribe to RSS Feed
- Permalink
- Report Inappropriate Content
if i select month jan 2014 i should get get dec 13 nov2013 oct2013
- Mark as New
- Bookmark
- Subscribe
- Mute
- Subscribe to RSS Feed
- Permalink
- Report Inappropriate Content
Exactly!, because you are not using a time dimension table AKA master calendar table. so you cannot roll over months that cross years that easy.
a SIMPLE time dimension would look like this:, so no matter the year and month, you just put MonthSerial instead of SHIP_MONTH and the calendar is linked via MonthSerial. There is a script I use. I will upload. for you.
TimeDimension:
LOAD * INLINE [
MonthSerial,Year,Month
1,2013,1
2,2013,2
3,2013,3
4,2013,4
5,2013,5
6,2013,6
7,2013,7
8,2013,8
9,2013,9
10,2013,10
11,2013,11
12,2013,12
13,2014,1
14,2014,2
15,2014,3
16,2014,4
17,2014,5
18,2014,6
19,2014,7
20,2014,8
21,2014,9
22,2014,10
23,2014,11
24,2014,12
];
load * INLINE [
Month,MonthName
1,Ene
2,Feb
3,Mar
4,Abr
5,May
6,Jun
7,Jul
8,Ago
9,Sep
10,Oct
11,Nov
12,Dic
];
- Mark as New
- Bookmark
- Subscribe
- Mute
- Subscribe to RSS Feed
- Permalink
- Report Inappropriate Content
try like in the calculated dimension
if(Month<Max(Month) and Month=>Max(Month)-3,Month)
and use the conditions as you need in the expression.
- Mark as New
- Bookmark
- Subscribe
- Mute
- Subscribe to RSS Feed
- Permalink
- Report Inappropriate Content
Hi Sivaraman,
Try this:
LOAD
num(SHIP_MONTH) as SHIP_MONTH,
TRANSPORT_MODE,
SHIP_YEAR,
SHIP_NO
FROM
(qvd);
Create a variable:
vSelectedmonth =GetFieldSelections(SHIP_MONTH)
now in chart:
exp:
count({<SHIP_MONTH={'$(vSelectedmonth)','$(vSelectedmonth)-1','$(vSelectedmonth)-2'}>}SHIP_NO)
Hope it works.
The issue is because in your data month is in 01,02,03 format wich should be converted to 1,2,3.
Regards
KC
KC
- Mark as New
- Bookmark
- Subscribe
- Mute
- Subscribe to RSS Feed
- Permalink
- Report Inappropriate Content
hi Jyothish
i have two exp one for air and sea
i cannot use in exp
- Mark as New
- Bookmark
- Subscribe
- Mute
- Subscribe to RSS Feed
- Permalink
- Report Inappropriate Content
You can add this part in you existing expression. It will work.
=count({<SHIP_MONTH={'$(vSelectedmonth)','$(vSelectedmonth)-1','$(vSelectedmonth)-2'},TRANSPORT_MODE={'AIR'}>}SHIP_NO)
=count({<SHIP_MONTH={'$(vSelectedmonth)','$(vSelectedmonth)-1','$(vSelectedmonth)-2'},TRANSPORT_MODE={'SEA'}>}SHIP_NO)
Hope it helps.
Regards
KC
KC
- Mark as New
- Bookmark
- Subscribe
- Mute
- Subscribe to RSS Feed
- Permalink
- Report Inappropriate Content
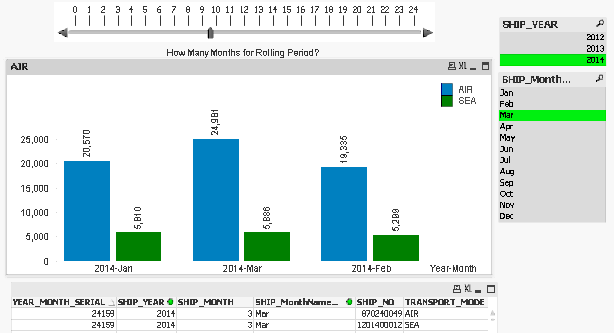
Here is the solution: I put a slider bar for the top N rolling period. Created a small solution for your time dimension, and show you how to place that range of dates in the expression.
now the expression loooks like follows: =COUNT({1 <TRANSPORT_MODE={'AIR'} ,YEAR_MONTH_SERIAL ={'>=$(=only(YEAR_MONTH_SERIAL)-HowMany)<=$(=only(YEAR_MONTH_SERIAL))'}>} SHIP_NO)