Unlock a world of possibilities! Login now and discover the exclusive benefits awaiting you.
- Qlik Community
- :
- All Forums
- :
- QlikView App Dev
- :
- Re: Calculating Average on Count(x) Expression
- Subscribe to RSS Feed
- Mark Topic as New
- Mark Topic as Read
- Float this Topic for Current User
- Bookmark
- Subscribe
- Mute
- Printer Friendly Page
- Mark as New
- Bookmark
- Subscribe
- Mute
- Subscribe to RSS Feed
- Permalink
- Report Inappropriate Content
Calculating Average on Count(x) Expression
Hello QV-Community
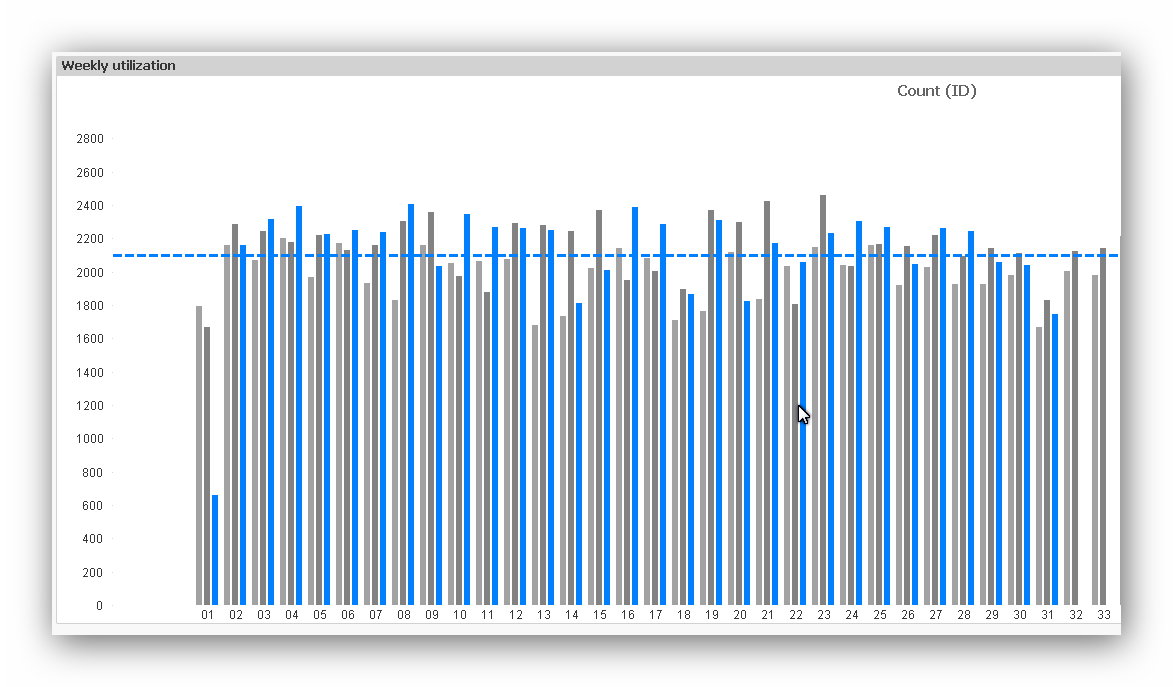
I try to calculate an average on an Count(x) expression. For a better understanding see the chart below.

The blue bars show the weekly count of radiology examinations. Now I want to calculate the average of this weekly count and show it as a horizontal line. I know, that there is a standard function for this, but I do not want to use this because I can not define the color properly. Se the following threat why:
Calculating average in weekly reporting of count of examinations
Due to the answer in this threat I want to realize the average line by a calculated reference line.
But I have now idea how to design an expression that fits my requirements. I tried things like Avg(Count(ID)). But I get not the right results. Is it even possible to use an standard expression on another standard expression???
Thank you for your help.
Achim
Accepted Solutions
- Mark as New
- Bookmark
- Subscribe
- Mute
- Subscribe to RSS Feed
- Permalink
- Report Inappropriate Content
- Mark as New
- Bookmark
- Subscribe
- Mute
- Subscribe to RSS Feed
- Permalink
- Report Inappropriate Content
Hi Achim,
Maybe something like this:
Avg(Aggr(Count(ID), Other Dimension)
You can also check this link by HIC
- Mark as New
- Bookmark
- Subscribe
- Mute
- Subscribe to RSS Feed
- Permalink
- Report Inappropriate Content
Hi Sinan
Thanks for helping me again.
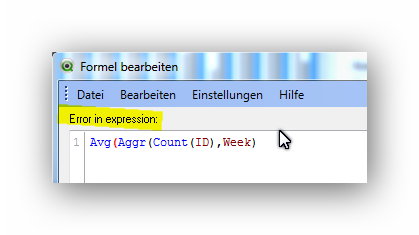
But I still do not come around with this expression. I tried:

But I already get an error in the editor field.
So I have no idea to calculate this average value. Thought about giving every record another field with a count of 1 to use "sum" instead of "count". But if I replace Count by Sum in the expression above it still gives me an error back.
Any further ideas?
Thought that should be easier.
Achim
- Mark as New
- Bookmark
- Subscribe
- Mute
- Subscribe to RSS Feed
- Permalink
- Report Inappropriate Content
You didn't close the Avg bracket:
Avg(Aggr(Count(ID), Week))
- Mark as New
- Bookmark
- Subscribe
- Mute
- Subscribe to RSS Feed
- Permalink
- Report Inappropriate Content
... too tired to see! Think I am dealing with this problem for too long. Sorry! You are totally right.
I am much closer now. Added "year" as a further dimension and get my desired average line ![]()
Thanks a lot.
Achim
- Mark as New
- Bookmark
- Subscribe
- Mute
- Subscribe to RSS Feed
- Permalink
- Report Inappropriate Content
It happens to everyone.
I am glad to help.
Take care.