Unlock a world of possibilities! Login now and discover the exclusive benefits awaiting you.
- Qlik Community
- :
- All Forums
- :
- QlikView App Dev
- :
- Calculating Week and Month Analysis
- Subscribe to RSS Feed
- Mark Topic as New
- Mark Topic as Read
- Float this Topic for Current User
- Bookmark
- Subscribe
- Mute
- Printer Friendly Page
- Mark as New
- Bookmark
- Subscribe
- Mute
- Subscribe to RSS Feed
- Permalink
- Report Inappropriate Content
Calculating Week and Month Analysis
Hey there
I am quite new to Qlikview, but have built some nice reporting KPIs. However there are some things thare starting to frustrate me, as i'm not sure how to build/create.
Firstly I wish to creat a table showing the quanity for the last 12 months, then the last 6 months, 3 months and then the last month. This would need to be a rolling effect.I have already defined the years; but require a breakdown each period.
Secondly, I need to creat a table to show the amount of cases for each week, with the averafge of last 2 weeks and last 26 weeks (after the last 2 weeks)
Please see the sample data attached (in excel). There are 2 tabs in the file
Look forward to your help.
- Mark as New
- Bookmark
- Subscribe
- Mute
- Subscribe to RSS Feed
- Permalink
- Report Inappropriate Content
See attached example. The source data is per date, not already aggregated per week. I used the Qlikview Components library to create a calendar and set analysis variables. Those are used in most of the expressions. It's not possible to combine the period averages in the same pivot table as the week counts. So the result is three tables, no two. I hope this helps you.
talk is cheap, supply exceeds demand
- Mark as New
- Bookmark
- Subscribe
- Mute
- Subscribe to RSS Feed
- Permalink
- Report Inappropriate Content
Thanks for your quick response
In relation to the period analysis (3,6,12 months); i had entered the suggested formulas with the slight alternation to match my data set. I change it up to be a Count formula, as to add count the number of items (and not the sum of).
count( $(vSetRolling12) syscreated)
count( $(vSetRolling6) syscreated)
count( $(vSetRolling3) syscreated)
count( $(vSetMTD) syscreated)
'syscreated' is a date field that is always populated, and is in the data set.
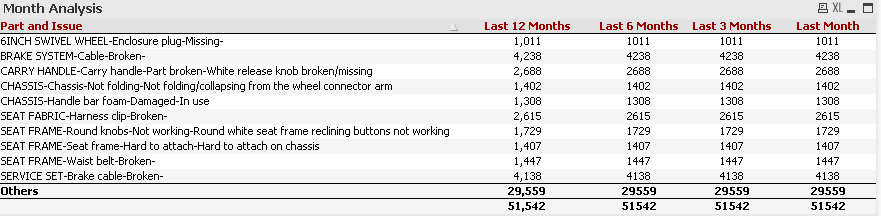
However, All 4 formulas produce the same figures. Where am i going wrong?
- Mark as New
- Bookmark
- Subscribe
- Mute
- Subscribe to RSS Feed
- Permalink
- Report Inappropriate Content
This is what I have so far
- Mark as New
- Bookmark
- Subscribe
- Mute
- Subscribe to RSS Feed
- Permalink
- Report Inappropriate Content
This is my current Master Calendar in the script:
Could you please advise the best way to add the additional variables - for 3 month, 6 month and 12 month rolling