Unlock a world of possibilities! Login now and discover the exclusive benefits awaiting you.
- Qlik Community
- :
- All Forums
- :
- QlikView App Dev
- :
- Calculating average of top N % of distribution
- Subscribe to RSS Feed
- Mark Topic as New
- Mark Topic as Read
- Float this Topic for Current User
- Bookmark
- Subscribe
- Mute
- Printer Friendly Page
- Mark as New
- Bookmark
- Subscribe
- Mute
- Subscribe to RSS Feed
- Permalink
- Report Inappropriate Content
Calculating average of top N % of distribution
Hi all,
I am trying to calculate the average of a subset of a distribution. In the picture below I show two examples.
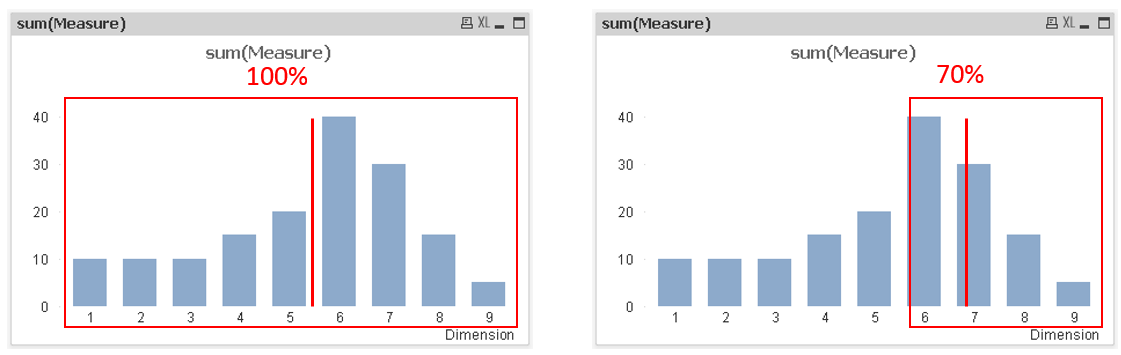
In the left chart, the average of the full distribution is calculated, with the following formula:
sum(Measure*Dimension)/sum(Measure)
However, what I'm trying to accomplish is calculating the average for the top 70% mass of the distribution. I am fairly certain that this can be achieved with a combination of the aggr, rank, rangesum, and similar functions, but I haven't gotten it to work.
Does anyone have any ideas?
Any help is greatly appreciated!
Best regards,
Niclas
- Mark as New
- Bookmark
- Subscribe
- Mute
- Subscribe to RSS Feed
- Permalink
- Report Inappropriate Content
These are the kind of solutions that I teach at the Masters Summit for Qlik, within my lecture about Set Analysis and AGGR(). If you posted a more specific example, I could give you a more specific solution. In the absence of a specific formula, here is a generic one:
avg = avg( AGGR( sum( {<Dimension= {"=(calculation of the bucket)>=7 "} >} Measure) , Dimension))
In a nutshell, you need to average out the results only for those Dimension values that were associated with the top three buckets.
Notice that by Dimension here I mean the actual dimension that's participating in the histogram, not the buckets 1-9. Again, it would be easier to explain on a more specific example.
cheers,
Oleg Troyansky
Upgrade your Qlik skills at the Masters Summit for Qlik - coming soon to Austin, TX and Johannesburg, South Africa!
If you can't make it to the Masters Summit, check out my book QlikView Your Business.
- Mark as New
- Bookmark
- Subscribe
- Mute
- Subscribe to RSS Feed
- Permalink
- Report Inappropriate Content
Dear Oleg,
Thanks for your reply. I will try to flesh out my problem a little, as well as provide a small sample application.
In my example, the total sum of my measure totals to 155. The measure is distributed over a dimension with values 1 to 9. The total distribution average, given the distribution, in this case comes out to 5.4 (see application). I want to know the average of the top 70% of my measure. In this case, I want to know the average of the 155*0.7=108.5 measure values which occur in the upper end of my distribution.
Thanks so much in advance!
Best regards,
Niclas