Unlock a world of possibilities! Login now and discover the exclusive benefits awaiting you.
Announcements
FLASH SALE: Save $500! Use code FLASH2026 at checkout until Feb 14th at 11:59PM ET. Register Now!
- Qlik Community
- :
- All Forums
- :
- QlikView App Dev
- :
- Calculating consecutive losses using above() funct...
Options
- Subscribe to RSS Feed
- Mark Topic as New
- Mark Topic as Read
- Float this Topic for Current User
- Bookmark
- Subscribe
- Mute
- Printer Friendly Page
Turn on suggestions
Auto-suggest helps you quickly narrow down your search results by suggesting possible matches as you type.
Showing results for
Creator
2017-09-14
10:38 PM
- Mark as New
- Bookmark
- Subscribe
- Mute
- Subscribe to RSS Feed
- Permalink
- Report Inappropriate Content
Calculating consecutive losses using above() function in a Chart
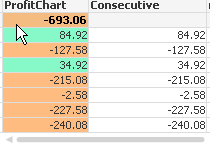
I am trying to use the above function, but I do not get any values using this
above(sum(Profit),1,3) for the Column: Consecutive. I dont understand why?
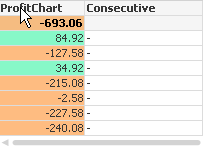
It only works when I use above(sum(Profit),0,3)
I do not understand why the above() function behaves like this?
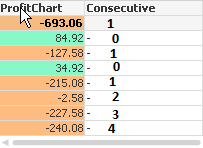
What I would like to achieve is calculating how many consecutive losses I get, so this is what I would like to see:
992 Views
1 Reply
Master III
2017-09-15
01:00 AM
- Mark as New
- Bookmark
- Subscribe
- Mute
- Subscribe to RSS Feed
- Permalink
- Report Inappropriate Content
Hi Daniel,
You can use an Expression like this
If(Sum(Profit) > 0,0,Above(Column(1))+1)
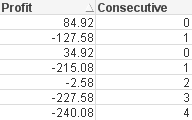
Regards,
Antonio
598 Views