Unlock a world of possibilities! Login now and discover the exclusive benefits awaiting you.
- Qlik Community
- :
- All Forums
- :
- QlikView App Dev
- :
- Calculating index in a Line Chart
- Subscribe to RSS Feed
- Mark Topic as New
- Mark Topic as Read
- Float this Topic for Current User
- Bookmark
- Subscribe
- Mute
- Printer Friendly Page
- Mark as New
- Bookmark
- Subscribe
- Mute
- Subscribe to RSS Feed
- Permalink
- Report Inappropriate Content
Calculating index in a Line Chart
Hi all
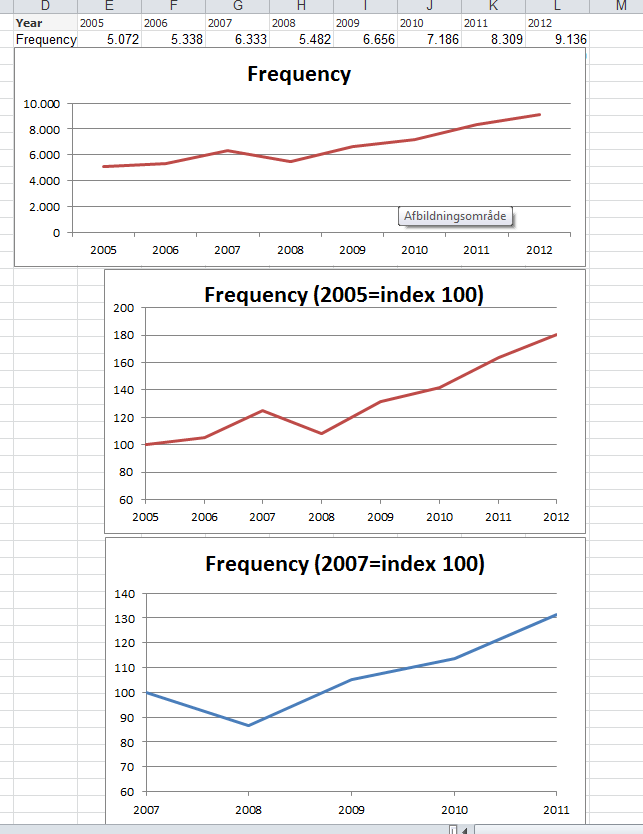
I've run in to a problem calculating an index in line charts, where index 100 is the first year selected in my list box containing my variable "Year" (from 2005-2012).
I want the index chart to look somewhat like #2 and #3 underneath (#1 is the "normal" line chart), and the index should only be calulated in the selected years (#2 has all years selected, and #3 has 2007-2011 selected). The dots in the index line chart should be calculated like this: (First Year in selection/Year)*100. For example in #3 this means:
- value for Year "2007": (6333/6333)*100=100
- value for Year "2008": (6333/5482)*100=87
- value for Year "2009": (6333/6666)*100=105
... and so on.
Can anyone help me on this one?
Thanks in advance 
Cheers
Bruno
 For
For
- Tags:
- new_to_qlikview
Accepted Solutions
- Mark as New
- Bookmark
- Subscribe
- Mute
- Subscribe to RSS Feed
- Permalink
- Report Inappropriate Content
Look into the chart inter record functions, namely top(). top() will return your expression evaluated in the context of your first dimension value, so try something like
=top( count(Frequency) ) / count(Frequency) * 100
Replace count(Frequency) with the expression you are currently using.
Hope this helps,
Stefan
- Mark as New
- Bookmark
- Subscribe
- Mute
- Subscribe to RSS Feed
- Permalink
- Report Inappropriate Content
Hi Stefan
It worked perfectly
Thanks a lot for your help!
Cheers Bruno
- Mark as New
- Bookmark
- Subscribe
- Mute
- Subscribe to RSS Feed
- Permalink
- Report Inappropriate Content
Hi Stefan
It worked perfectly
Thanks a lot for your help!
Cheers Bruno