Unlock a world of possibilities! Login now and discover the exclusive benefits awaiting you.
- Qlik Community
- :
- All Forums
- :
- QlikView App Dev
- :
- Re: Calculating total grouped on absent field.
- Subscribe to RSS Feed
- Mark Topic as New
- Mark Topic as Read
- Float this Topic for Current User
- Bookmark
- Subscribe
- Mute
- Printer Friendly Page
- Mark as New
- Bookmark
- Subscribe
- Mute
- Subscribe to RSS Feed
- Permalink
- Report Inappropriate Content
Calculating total grouped on absent field.
Currently have a chart which sums the number of hours assigned to a resource by week and applies a flag if the hours for the week exceed 5 (see below)
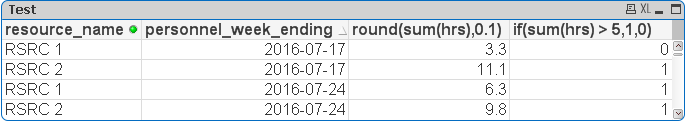
That I would like is a chart that only contains the week ending and the number of times that the flag has been breached that week. Using the above sample we would get the following result.
| personnel_week_ending | total_breaches |
|---|---|
| 2016-07-17 | 1 |
| 2016-07-24 | 2 |
Any ideas on the formula required to calculate the total_breaches expression while removing the resource_name dimension from the chart would be much appreciated?
Accepted Solutions
- Mark as New
- Bookmark
- Subscribe
- Mute
- Subscribe to RSS Feed
- Permalink
- Report Inappropriate Content
Thanks for the reply Sunny that was close what actually worked was:
Sum(If(Aggr(Sum(hrs),resource_name,personnel_week_ending)>5,1,0))
- Mark as New
- Bookmark
- Subscribe
- Mute
- Subscribe to RSS Feed
- Permalink
- Report Inappropriate Content
see this
- Mark as New
- Bookmark
- Subscribe
- Mute
- Subscribe to RSS Feed
- Permalink
- Report Inappropriate Content
May be like this as your expression:
Sum(Aggr(If(Sum(hrs) > 5, 1, 0), resource_name, personnel_week_ending))
- Mark as New
- Bookmark
- Subscribe
- Mute
- Subscribe to RSS Feed
- Permalink
- Report Inappropriate Content
Thanks for the reply Sunny that was close what actually worked was:
Sum(If(Aggr(Sum(hrs),resource_name,personnel_week_ending)>5,1,0))
- Mark as New
- Bookmark
- Subscribe
- Mute
- Subscribe to RSS Feed
- Permalink
- Report Inappropriate Content
nailed it thank you