Unlock a world of possibilities! Login now and discover the exclusive benefits awaiting you.
- Qlik Community
- :
- All Forums
- :
- QlikView App Dev
- :
- Re: Calculation Error in Table Chart
- Subscribe to RSS Feed
- Mark Topic as New
- Mark Topic as Read
- Float this Topic for Current User
- Bookmark
- Subscribe
- Mute
- Printer Friendly Page
- Mark as New
- Bookmark
- Subscribe
- Mute
- Subscribe to RSS Feed
- Permalink
- Report Inappropriate Content
Calculation Error in Table Chart
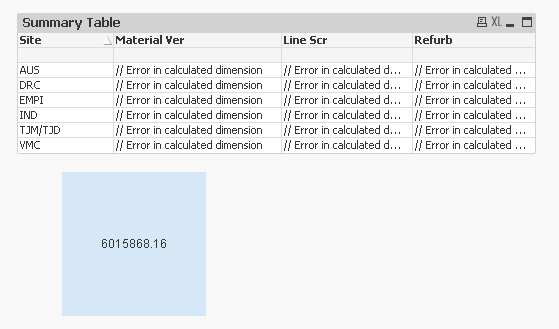
I am creating a table chart from a spreadsheet load using cross table.
I'm trying to create a Summary listing Sites as a Dimension and several columns by Type. The calculation I am using is as follows:
=sum({<[Type] = {'Material Variance'} >} Data)
This repeats for the other "Types" (Line Scrap, Refurbish, etc). But I am getting "//Error in calculated dimension". I need a total sum of each Type for each Site. The formula does give an amount in the Text Box, but doesn't filter by the Type specificed.
The QVD and Spreadsheet are attached.
Thanks
Accepted Solutions
- Mark as New
- Bookmark
- Subscribe
- Mute
- Subscribe to RSS Feed
- Permalink
- Report Inappropriate Content
Set analysis won't work in Dimension level. It will work only on expression level
- Mark as New
- Bookmark
- Subscribe
- Mute
- Subscribe to RSS Feed
- Permalink
- Report Inappropriate Content
Set analysis won't work in Dimension level. It will work only on expression level
- Mark as New
- Bookmark
- Subscribe
- Mute
- Subscribe to RSS Feed
- Permalink
- Report Inappropriate Content
Try like this
Aggr(sum({<[Type] = {'Material Variance'} >} Data),Dimensions)
- Mark as New
- Bookmark
- Subscribe
- Mute
- Subscribe to RSS Feed
- Permalink
- Report Inappropriate Content
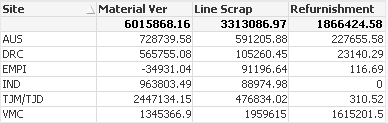
Are you looking for something like :
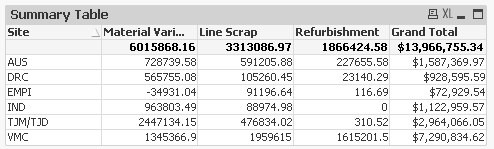
If so, take the calculated dimensions to Expression tab.
- Mark as New
- Bookmark
- Subscribe
- Mute
- Subscribe to RSS Feed
- Permalink
- Report Inappropriate Content
Anil, thanks so much for the help. It worked perfectly.
Jeff
- Mark as New
- Bookmark
- Subscribe
- Mute
- Subscribe to RSS Feed
- Permalink
- Report Inappropriate Content
Thanks Tresesco.
Jeff
- Mark as New
- Bookmark
- Subscribe
- Mute
- Subscribe to RSS Feed
- Permalink
- Report Inappropriate Content
Anil Babu Samineni wrote:
Set analysis won't work in Dimension level. It will work only on expression level
This is not true.
The same can be done in the dimension level as well, you would just need an aggr() like:
=Aggr(sum({<[Type] = {'Material Variance'} >} Data) , Site)
- Mark as New
- Bookmark
- Subscribe
- Mute
- Subscribe to RSS Feed
- Permalink
- Report Inappropriate Content
True, I am saying about his way without Aggr function. And then the same way you suggested in the expression that is the same way I've given and followed. Thanks for thought