Unlock a world of possibilities! Login now and discover the exclusive benefits awaiting you.
- Qlik Community
- :
- All Forums
- :
- QlikView App Dev
- :
- Re: Can I load Excel file that have 2 levels of he...
- Subscribe to RSS Feed
- Mark Topic as New
- Mark Topic as Read
- Float this Topic for Current User
- Bookmark
- Subscribe
- Mute
- Printer Friendly Page
- Mark as New
- Bookmark
- Subscribe
- Mute
- Subscribe to RSS Feed
- Permalink
- Report Inappropriate Content
Can I load Excel file that have 2 levels of header ?
HI,
I have a question about loading Excel file.
The Excel header is consist of 2 level, dimension hierarchy.
In this case, is there any way to load ?
Thanks in advance,
WanKi,
Accepted Solutions
- Mark as New
- Bookmark
- Subscribe
- Mute
- Subscribe to RSS Feed
- Permalink
- Report Inappropriate Content
- Mark as New
- Bookmark
- Subscribe
- Mute
- Subscribe to RSS Feed
- Permalink
- Report Inappropriate Content
Hi,
Yes you can..
Try below:
LOAD Year,
SUM,
Internet,
Call,
Mail,
Visit,
[E-Mail],
Completed,
Processing,
Return,
Cancel
FROM
[..\My Documents\Downloads\CustomerReport1.xlsx]
(ooxml, embedded labels, table is Sheet1, filters(
Replace(1, top, StrCnd(null)),
Replace(2, top, StrCnd(null)),
Replace(11, top, StrCnd(null)),
Remove(Row, RowCnd(Interval, Pos(Top, 1), Pos(Top, 1), Select(1, 0))),
Remove(Row, RowCnd(Compound,
RowCnd(CellValue, 3, StrCnd(null)),
RowCnd(CellValue, 4, StrCnd(null)),
RowCnd(CellValue, 5, StrCnd(null)),
RowCnd(CellValue, 6, StrCnd(null)),
RowCnd(CellValue, 7, StrCnd(null))
))
));
- Mark as New
- Bookmark
- Subscribe
- Mute
- Subscribe to RSS Feed
- Permalink
- Report Inappropriate Content
PFA,
Hope it helps
- Mark as New
- Bookmark
- Subscribe
- Mute
- Subscribe to RSS Feed
- Permalink
- Report Inappropriate Content
HI,
Thank you so much your reply.
It is very helpful.. 
WanKi,
- Mark as New
- Bookmark
- Subscribe
- Mute
- Subscribe to RSS Feed
- Permalink
- Report Inappropriate Content
Thank you very much for your perfect answer.
Thank you.
WanKi,
- Mark as New
- Bookmark
- Subscribe
- Mute
- Subscribe to RSS Feed
- Permalink
- Report Inappropriate Content
Hi Gupta,
I got your perfect help. Once again thank you for your help.
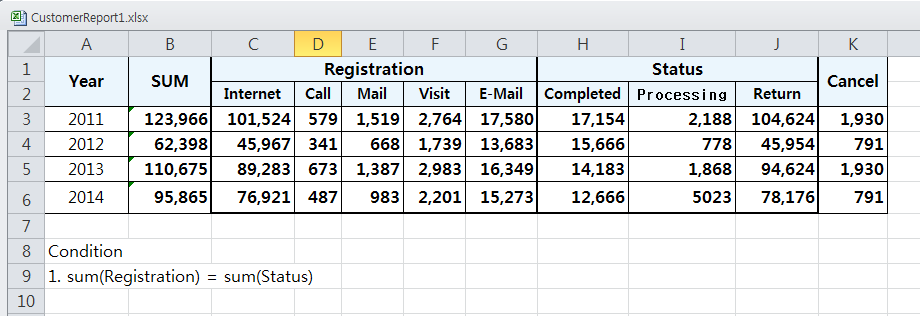
After your help I tried to load a Excel file which has a three-level header . But I got some questions as below.
1) If the level has a hierarchy structure like image , How can I load the excel file ? Can I load the same name of attributes ? If not, I have to create another dimension for the hierarchy ?
2) The second thing is merging cells(Please see the image below).
You can see attributes, 'SUM' and 'Cancel'. In two-level header cells are merged, but in three-level don't .
Load script is the same, but I don't know why it makes a different result.
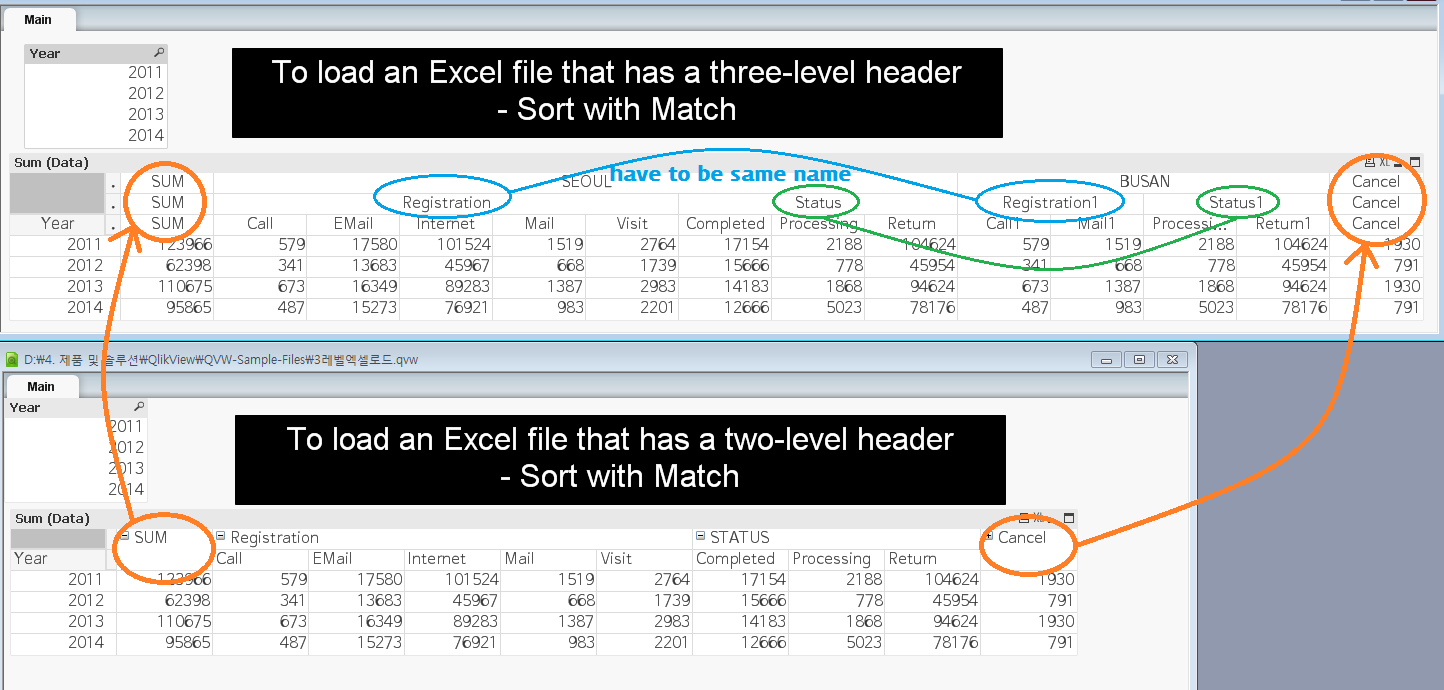
Please help me out again.
WanKi,
- Mark as New
- Bookmark
- Subscribe
- Mute
- Subscribe to RSS Feed
- Permalink
- Report Inappropriate Content
Hi,
another generic approach:
Re: Re: Re: Cross table manipulation
Input:
| Tickers | GS EPS YTD revisions | GS EPS 12m revisions | ||||||
| FY14 | FY15 | FY16 | FY17 | FY14 | FY15 | FY16 | FY17 | |
| M.L | 2.3% | 0.5% | 34.1% | 14.1% | 247.1% | 848.7% | 1360.9% | 506.2% |
| GG.L | -89.2% | -300.8% | -60.6% | 33.7% | -91.7% | -2290.9% | -526.7% | -168.9% |
Result:


using this script:
tabColName:
CrossTable (ColID, ColName)
LOAD RecNo() as RecNo, *
FROM [http://community.qlik.com/thread/131168] (html, codepage is 1252, no labels, table is @3)
Where RecNo()<3;

mapColName:
Mapping LOAD
  ColID,
  Concat(ColName, ':', RecNo) as ColName
Resident tabColName
Group By ColID;

DROP Table tabColName;

tabData:
CrossTable (Col, Value)
LOAD *
FROM [http://community.qlik.com/thread/131168] (html, codepage is 1252, no labels, table is @3)
Where RecNo()>3;

Left Join (tabData)
LOAD Col,
    SubField(Category, ':', 1) as Category,
    Dual(SubField(Category, ':', 2), Right(SubField(Category, ':', 2),2)) as FY;
LOAD Distinct
  Col,
  ApplyMap('mapColName', Col) as Category
Resident tabData;

RENAME Fields using mapColName;

DROP Field Col;
hope this helps
regards
Marco
- Mark as New
- Bookmark
- Subscribe
- Mute
- Subscribe to RSS Feed
- Permalink
- Report Inappropriate Content
Thank you so much Marco.
I will try as you reply.
WanKi,
- Mark as New
- Bookmark
- Subscribe
- Mute
- Subscribe to RSS Feed
- Permalink
- Report Inappropriate Content
You're welcome
Regards
Marco
- Mark as New
- Bookmark
- Subscribe
- Mute
- Subscribe to RSS Feed
- Permalink
- Report Inappropriate Content
Hi, Appreciate you can provide the steps to perform that.
Thanks