Unlock a world of possibilities! Login now and discover the exclusive benefits awaiting you.
- Qlik Community
- :
- All Forums
- :
- QlikView App Dev
- :
- Can one set the color of individual bars in a mini...
- Subscribe to RSS Feed
- Mark Topic as New
- Mark Topic as Read
- Float this Topic for Current User
- Bookmark
- Subscribe
- Mute
- Printer Friendly Page
- Mark as New
- Bookmark
- Subscribe
- Mute
- Subscribe to RSS Feed
- Permalink
- Report Inappropriate Content
Can one set the color of individual bars in a mini chart?
I have a table with the dimension "E-commerce sales rep", and an expression for "Final attainment this month", which is displayed as a mini chart over the dimension "Attainment year and month". So far, so groovy:
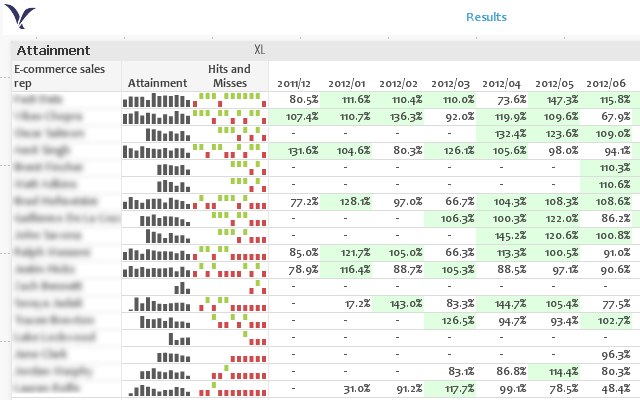
What I'd like to do now is color the columns in the "Attainment" column green or red, depending on whether the rep met his or her goal (e.g. >= 100% attainment) for that month. This would let me drop the "Hits and Misses" column, increasing information density.
However, I have not been able to craft the right expression, or perhaps I'm putting it in the wrong place. Under Mini Chart Settings | Color | Base Color | Calculated, I started with this expression:
=If(Avg([Final attainment this month]) >= 1.0, RGB(165, 207, 75), RGB(207, 75, 75))
This ought to give green for attainments of 100% or higher, and red for all others. Instead, I get red across the board, which makes sense only in that the overall average, across all reps and months, is 0.89. Perhaps I need an Aggr() in here? I tried these variants, with no change, still all red:
=If(Aggr(Avg([Final attainment this month]), [E-commerce sales rep]) >= 1.0, RGB(165, 207, 75), RGB(207, 75, 75))
=If(Aggr(Avg([Final attainment this month]), [E-commerce sales rep], [Attainment year and month]) >= 1.0, RGB(165, 207, 75), RGB(207, 75, 75))
=If(Aggr(Avg([Final attainment this month]), [Final attainment this month]) >= 1.0, RGB(165, 207, 75), RGB(207, 75, 75))
Some reps certainly have achieved 100%+ attainment, as you can see in the screen shot and the second mini chart. Is the color expression being evaluated only once for the entire table, making it impossible to reflect specific dimensions? That seems like an odd omission. Some reps have an overall average, across all months, over 100%, and I'd expect QlikView to at least evaluate the expression separately for each mini chart, meaning for each sales rep in this context.
If it matters, there's only one record for each rep/month intersection, so the Avg() function is in practice doing nothing. I include it to allow for replacing the existing simple sales rep dimension with a sales team dimension, or examining attainment over years rather than months, if I choose to do so in the future.
Any ideas? Has anyone tried to do this and either succeed or established it as impossible? Thank you!
Jonathan Shaltz
Accepted Solutions
- Mark as New
- Bookmark
- Subscribe
- Mute
- Subscribe to RSS Feed
- Permalink
- Report Inappropriate Content
- Mark as New
- Bookmark
- Subscribe
- Mute
- Subscribe to RSS Feed
- Permalink
- Report Inappropriate Content
Hi
can u post the sample file. that will be helpful..
- Mark as New
- Bookmark
- Subscribe
- Mute
- Subscribe to RSS Feed
- Permalink
- Report Inappropriate Content
It's an abstract question: is it possible to set the bar color for each bar in a mini chart?
- Mark as New
- Bookmark
- Subscribe
- Mute
- Subscribe to RSS Feed
- Permalink
- Report Inappropriate Content
No, that's not possible.
talk is cheap, supply exceeds demand
- Mark as New
- Bookmark
- Subscribe
- Mute
- Subscribe to RSS Feed
- Permalink
- Report Inappropriate Content
Sadness. Thanks for the answer!