Unlock a world of possibilities! Login now and discover the exclusive benefits awaiting you.
- Qlik Community
- :
- All Forums
- :
- QlikView App Dev
- :
- Can we plot the data in the bar chart like in the ...
Options
- Subscribe to RSS Feed
- Mark Topic as New
- Mark Topic as Read
- Float this Topic for Current User
- Bookmark
- Subscribe
- Mute
- Printer Friendly Page
Turn on suggestions
Auto-suggest helps you quickly narrow down your search results by suggesting possible matches as you type.
Showing results for
Not applicable
2012-09-05
07:47 AM
- Mark as New
- Bookmark
- Subscribe
- Mute
- Subscribe to RSS Feed
- Permalink
- Report Inappropriate Content
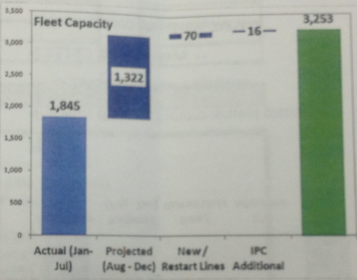
Can we plot the data in the bar chart like in the attached image?
Hi All,
Is it possible to plot the data in the barchart like in the attached image.
Regards
Kumar
1,058 Views
4 Replies
MVP
2012-09-05
08:29 AM
- Mark as New
- Bookmark
- Subscribe
- Mute
- Subscribe to RSS Feed
- Permalink
- Report Inappropriate Content
It is possible by using "Bar Offset" under your Expression(s):
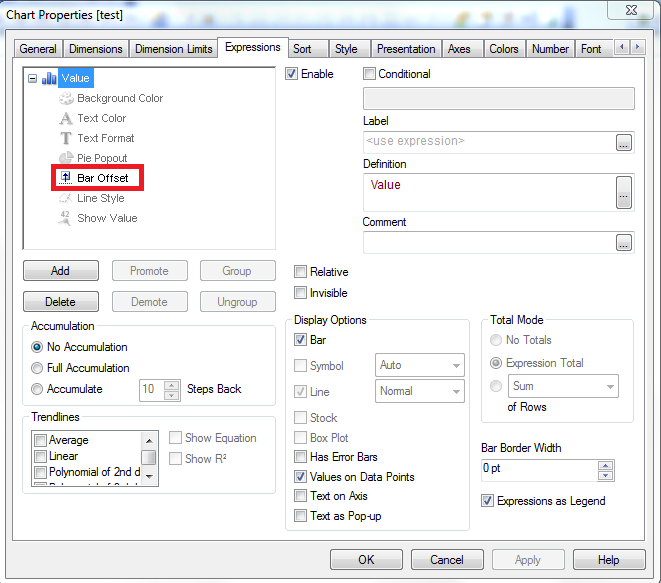
I have also attached an example .qvw file.
558 Views
Not applicable
2012-09-05
09:10 AM
Author
- Mark as New
- Bookmark
- Subscribe
- Mute
- Subscribe to RSS Feed
- Permalink
- Report Inappropriate Content
Hi ,
Thanks but i can't achieve like how exactly i need.
see the attached image how i am getting after "baroffset" value set.
Regards
Kumar
558 Views
Creator III
2012-09-05
09:23 AM
- Mark as New
- Bookmark
- Subscribe
- Mute
- Subscribe to RSS Feed
- Permalink
- Report Inappropriate Content
You'll need an expression for each bar; so the offset for Bar2 would be expression of Bar1. The offset for Bar3 would be the expression of Bar1 + Bar2, and I guess you'd want a total bar as well. See attached.
558 Views
Master II
2012-09-05
03:06 PM
- Mark as New
- Bookmark
- Subscribe
- Mute
- Subscribe to RSS Feed
- Permalink
- Report Inappropriate Content
558 Views