Unlock a world of possibilities! Login now and discover the exclusive benefits awaiting you.
- Qlik Community
- :
- All Forums
- :
- QlikView App Dev
- :
- Re: Cannot get distinct count right by dimension
- Subscribe to RSS Feed
- Mark Topic as New
- Mark Topic as Read
- Float this Topic for Current User
- Bookmark
- Subscribe
- Mute
- Printer Friendly Page
- Mark as New
- Bookmark
- Subscribe
- Mute
- Subscribe to RSS Feed
- Permalink
- Report Inappropriate Content
Cannot get distinct count right by dimension
Hi,
I am trying to get a count by "status" in the table below - in pie char
I am expecting - 2 pass and 2 fail - for start time at 2pm (first table) and 1 pass and 3 fail at 3 pm.
Please help!
test_suite_id test_case_id status start_time
suite1 case1 pass 9/12/2012 2pm
suite1 case2 pass 9/12/2012 2pm
suite1 case3 fail 9/12/2012 2pm
suite1 case4 fail 9/12/2012 2pm
suite1 case1 pass 9/12/2012 3pm
suite1 case2 fail 9/12/2012 3pm
suite1 case3 fail 9/12/2012 3pm
suite1 case4 fail 9/12/2012 3pm
- Tags:
- aggr
- Mark as New
- Bookmark
- Subscribe
- Mute
- Subscribe to RSS Feed
- Permalink
- Report Inappropriate Content
Hope this helps!
- Mark as New
- Bookmark
- Subscribe
- Mute
- Subscribe to RSS Feed
- Permalink
- Report Inappropriate Content
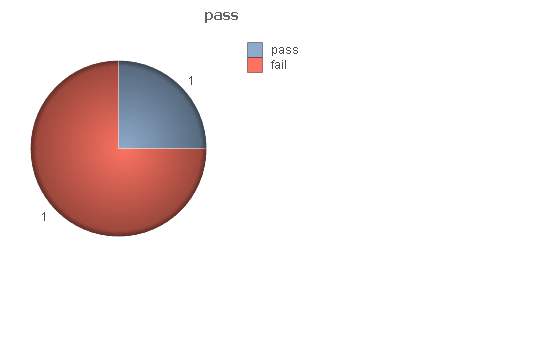
Thanks so much for the quick response. It gives me the correct graph, however when I check show values on data points, on the pie chart it shows me 1, 1 for the 3 pm case where it should show 3/1. How can I see the right counts?
- Mark as New
- Bookmark
- Subscribe
- Mute
- Subscribe to RSS Feed
- Permalink
- Report Inappropriate Content
Also, by default I have a date range selected, so for each test suite, within a date range, I want the count for the latest date (max on date). If I use the answer in your response, I get it right for one date selection, however, it doesn't work for a date range
- Mark as New
- Bookmark
- Subscribe
- Mute
- Subscribe to RSS Feed
- Permalink
- Report Inappropriate Content
max date seems to be working and values I added in the legend. Value on data points acts strange, and it is Sunday today.. 
- Mark as New
- Bookmark
- Subscribe
- Mute
- Subscribe to RSS Feed
- Permalink
- Report Inappropriate Content
Hi, sapte123.
Why not just create a pie chart with 'status' as dimension and Count(status) as expression ?
- Mark as New
- Bookmark
- Subscribe
- Mute
- Subscribe to RSS Feed
- Permalink
- Report Inappropriate Content
Thanks! max works for start_time. But in my actual data I have more test suites and each having different test cases. So the moment I add this data to your qvw, the pass fail counts are off. I am expecting - 16 fail and 6 pass. I get the accurate results only when I select the time.
So what I am looking for is without any filter, I want a max(Start_time) - group by test_suite, test_case
suite2, case1, pass, 9/12/2012 2pm
suite2, case2, pass, 9/12/2012 2pm
suite2, case3, fail, 9/12/2012 2pm
suite2, case4, fail, 9/12/2012 2pm
suite2, case1, pass, 9/12/2012 3pm
suite2, case2, fail, 9/12/2012 3pm
suite2, case3, fail, 9/12/2012 3pm
suite2, case4, fail, 9/12/2012 3pm
suite2, case4, fail, 9/12/2012 4pm
suite2, case2, fail, 9/12/2012 4pm
suite2, case3, fail, 9/12/2012 4pm
]