Unlock a world of possibilities! Login now and discover the exclusive benefits awaiting you.
- Qlik Community
- :
- All Forums
- :
- QlikView App Dev
- :
- Re: Change Color Data Appearance
- Subscribe to RSS Feed
- Mark Topic as New
- Mark Topic as Read
- Float this Topic for Current User
- Bookmark
- Subscribe
- Mute
- Printer Friendly Page
- Mark as New
- Bookmark
- Subscribe
- Mute
- Subscribe to RSS Feed
- Permalink
- Report Inappropriate Content
Change Color Data Appearance
I have a chart with amount of orders per month. "count(OrderID)" Dimension "Month"
I also added 5 other expressions with the order amount per month from the previous years
"count({<Year={$(=Year-1)}>} OrderID)" 2014
"count({<Year={$(=Year-2)}>} OrderID)" 2013
"count({<Year={$(=Year-3)}>} OrderID)" 2012
"count({<Year={$(=Year-4)}>} OrderID)" 2011
"count({<Year={$(=Year-5)}>} OrderID)" 2010
The expressions from 2013 until 2010 I gave a conditional show controlled by a dropdown box where the user can select if he wants to look back only 1 year, or 2, 3, 4 or 5 years back.
My problem now is that with this conditional show the "persistent colors" function doesn't work anymore. The colors change every time I add of remove one or more of the expressions.
Anyone has any idea how to solve this?
Accepted Solutions
- Mark as New
- Bookmark
- Subscribe
- Mute
- Subscribe to RSS Feed
- Permalink
- Report Inappropriate Content
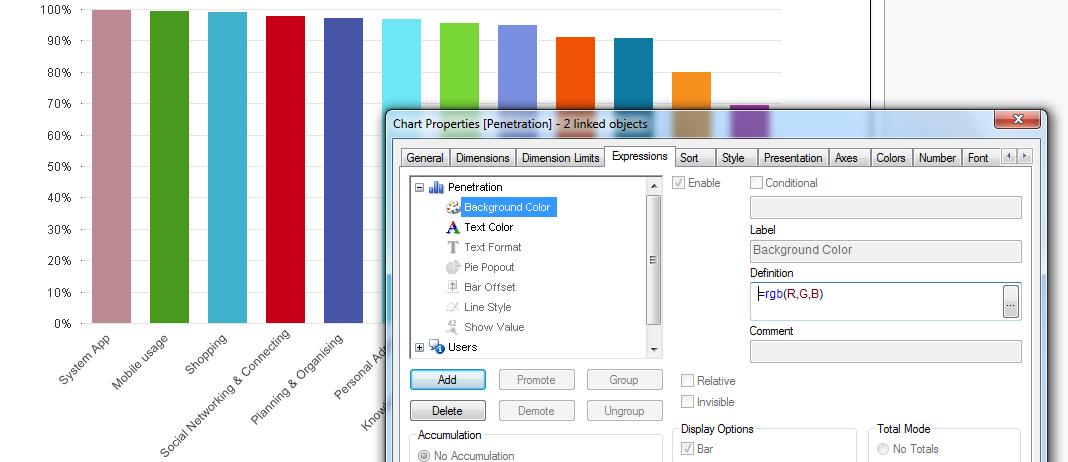
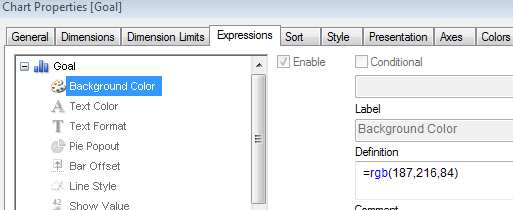
you can add background color for each of your expression.
- Mark as New
- Bookmark
- Subscribe
- Mute
- Subscribe to RSS Feed
- Permalink
- Report Inappropriate Content
you can add background color for each of your expression.
- Mark as New
- Bookmark
- Subscribe
- Mute
- Subscribe to RSS Feed
- Permalink
- Report Inappropriate Content
try tios way for ur each expression,
- Mark as New
- Bookmark
- Subscribe
- Mute
- Subscribe to RSS Feed
- Permalink
- Report Inappropriate Content
Expand the expression options by clicking on the + sign in front of the expression and set a color for each