Unlock a world of possibilities! Login now and discover the exclusive benefits awaiting you.
- Qlik Community
- :
- All Forums
- :
- QlikView App Dev
- :
- Re: Re: Change Color of Gauge Chart Based on IF St...
- Subscribe to RSS Feed
- Mark Topic as New
- Mark Topic as Read
- Float this Topic for Current User
- Bookmark
- Subscribe
- Mute
- Printer Friendly Page
- Mark as New
- Bookmark
- Subscribe
- Mute
- Subscribe to RSS Feed
- Permalink
- Report Inappropriate Content
Change Color of Gauge Chart Based on IF Statement
Hi Everyone,
I am attempting to set the text color in a gauge chart based on the following if statement:
=if(sum(rm_LINESPICKED) / (sum(rm_LINESPICKED) + SUM(rm_LINES)) < 0.33, RGB(0,240,120),
if(sum(rm_LINESPICKED) / (sum(rm_LINESPICKED) + SUM(rm_LINES)) >= 0.33 and sum(rm_LINESPICKED) / (sum(rm_LINESPICKED) + SUM(rm_LINES)) < 0.66, RGB(40,240,120),
RGB(60,240,120)))
The expression "sum(rm_LINESPICKED) / (sum(rm_LINESPICKED) + SUM(rm_LINES))" evaluates to 0.31, so I would like for the color to be RGB(0,240,120). However, the color is defaulting to RGB(60,240,120).
I have looked through similar posts but I have not been able to find a correct answer. Does anybody see what I am doing wrong?
Thanks!
Michael
- Mark as New
- Bookmark
- Subscribe
- Mute
- Subscribe to RSS Feed
- Permalink
- Report Inappropriate Content
can you share the app? ... or a perhaps a qvw built off sample data that shows the issue
- Mark as New
- Bookmark
- Subscribe
- Mute
- Subscribe to RSS Feed
- Permalink
- Report Inappropriate Content
Jonathan, I unfortunately cannot share the app.
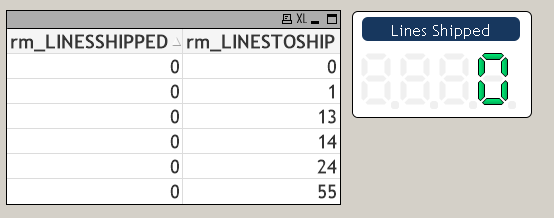
Here is a screenshot based off the raw data. The number displayed in the gauge chart is sum(rm_linesshipped).
I would like to change the LED color based on the % of total lines shipped. I am calculating % of total lines shipped as:
sum(rm_linesshipped) / (sum(rm_linestoship) + sum(rm_linesshipped)) as the % of total lines shipped.
I am attempting to change the LED color based on an IF statement similar to this:
if % shipped < 0.33, then LED = red
if 0.33 <= % shipped < 0.66, then LED = yellow
if 0.66 <= % shipped, then LED = green
In this case, 0% of the lines have been shipped, so the LED color should be red.
- Mark as New
- Bookmark
- Subscribe
- Mute
- Subscribe to RSS Feed
- Permalink
- Report Inappropriate Content
an example in attachment