Unlock a world of possibilities! Login now and discover the exclusive benefits awaiting you.
- Qlik Community
- :
- All Forums
- :
- QlikView App Dev
- :
- Change grouping based on number of filter selectio...
- Subscribe to RSS Feed
- Mark Topic as New
- Mark Topic as Read
- Float this Topic for Current User
- Bookmark
- Subscribe
- Mute
- Printer Friendly Page
- Mark as New
- Bookmark
- Subscribe
- Mute
- Subscribe to RSS Feed
- Permalink
- Report Inappropriate Content
Change grouping based on number of filter selection
Hello,
I am new to Qlik and I got a requirement to make a particular chart dynamic where in it will show dimension A if only 1 value is selected and dimension B if multiple values are selected on a filter. Right now, I have it as a cyclic group that manually switches when user clicks on it really basic stuff. Wondering if there is a way to accomplish my requirement in Qlikview (hopefully nothing too complex).
Thank you!
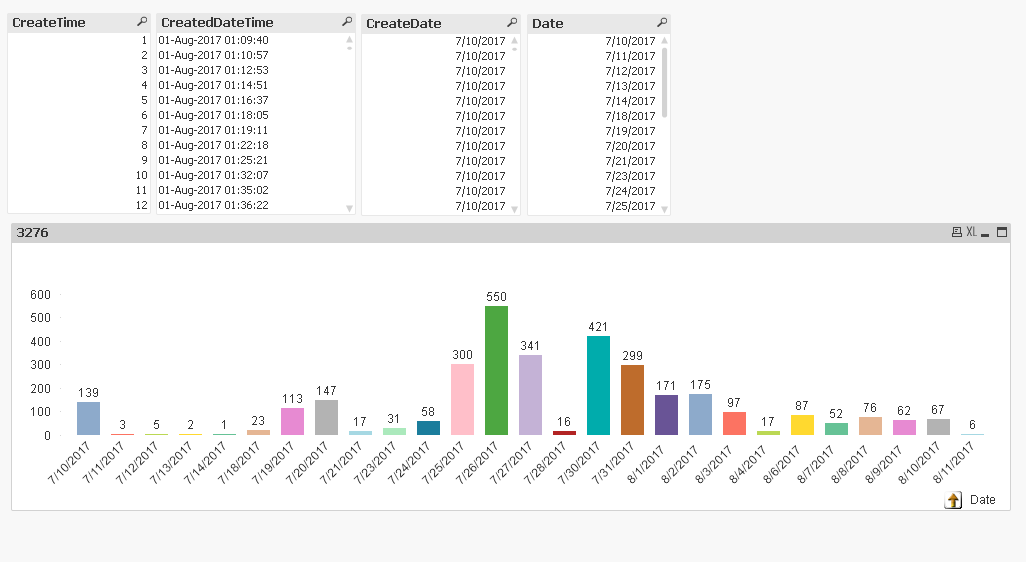
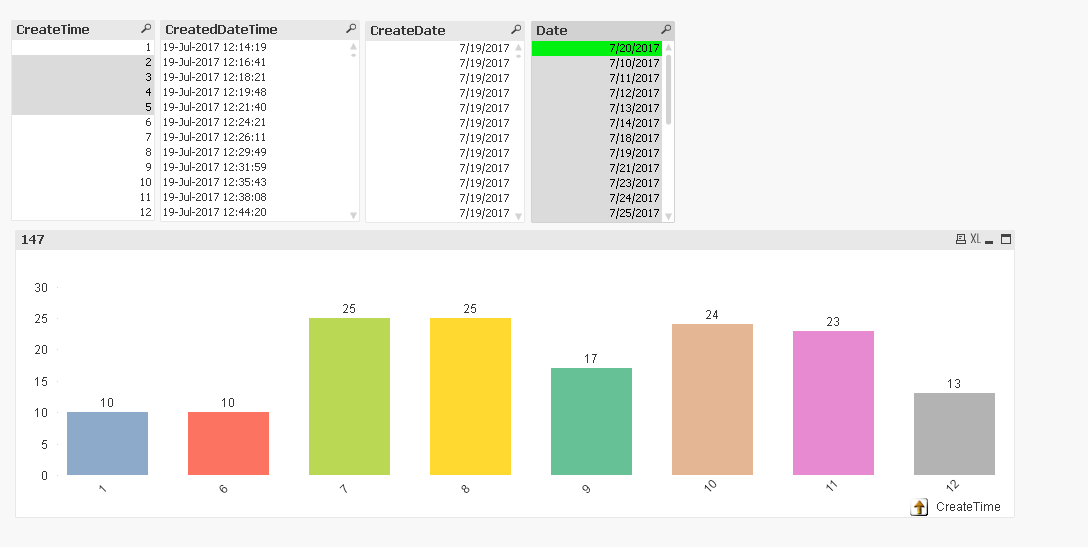
Little bit more info, the filter will be a calendar filter wherein 1 date can have multiple records because of the timestamp. Basically if only one day is selected I want the chart to show the hours on that day (if possible from hour 0-23). And if multiple days are selected I want it to show the days on the chart.
- « Previous Replies
-
- 1
- 2
- Next Replies »
- Mark as New
- Bookmark
- Subscribe
- Mute
- Subscribe to RSS Feed
- Permalink
- Report Inappropriate Content
Dear,
here you go
i created a sample file have a look on it,
LOAD RecNo() as Flag,
CreatedDateTime,
Date(Round(Date#(CreatedDateTime,'DD-MMM-YYYY hh:mm:ss'))) as Date,
Date(Date#(CreatedDateTime,'DD-MMM-YYYY hh:mm:ss')) as CreateDate,
hour(Date#(CreatedDateTime,'DD-MMM-YYYY hh:mm:ss')) as CreateTime
FROM
(biff, embedded labels, table is Sheet1$);
- « Previous Replies
-
- 1
- 2
- Next Replies »