Not applicable
2012-06-12
06:33 AM
- Mark as New
- Bookmark
- Subscribe
- Mute
- Subscribe to RSS Feed
- Permalink
- Report Inappropriate Content
Change the Font color or highlight the total in pivot table
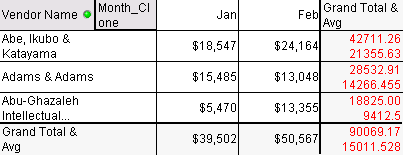
i Have used the below code to get both average and total , when we check subtotal box in pivot table. But i need to change the color of average and total to differentiate it, how can i do this
=if( secondarydimensionality()=0,
sum([Amount To Pay LC]) & chr(10) &
avg(aggr(sum([Amount To Pay LC]), [Vendor Name], Month)),
sum([Amount To Pay LC])
)
2,466 Views
2 Replies
Partner - Champion III
2012-06-12
06:39 AM
- Mark as New
- Bookmark
- Subscribe
- Mute
- Subscribe to RSS Feed
- Permalink
- Report Inappropriate Content
Hi
Cant see your image, but I think what you need is as follows:
- On the expressions tab, for that expression, click the + icon
- Select Text Color
- In the Definition box, enter your colour expression; something like:
=If(SecondaryDimensionality() = 0, LightRed(), LightGreen())
(change the colour as required. You can also use the RGB() or ARGB() functions to set colours by rgb values)
Hope that helps
Jonathan
Logic will get you from a to b. Imagination will take you everywhere. - A Einstein
897 Views
Not applicable
2012-06-12
06:52 AM
Author
- Mark as New
- Bookmark
- Subscribe
- Mute
- Subscribe to RSS Feed
- Permalink
- Report Inappropriate Content
Hi Jonathan,
When i apply the code , it gives the attached output, Both total and average are in red color in the last colum. I want it to be
| different. Or i want to add a text showing 1st line Total= | 2nd line Avg= So that we can come to know which is total and avg |
897 Views