Unlock a world of possibilities! Login now and discover the exclusive benefits awaiting you.
- Qlik Community
- :
- All Forums
- :
- QlikView App Dev
- :
- Change the chart color if...
Options
- Subscribe to RSS Feed
- Mark Topic as New
- Mark Topic as Read
- Float this Topic for Current User
- Bookmark
- Subscribe
- Mute
- Printer Friendly Page
Turn on suggestions
Auto-suggest helps you quickly narrow down your search results by suggesting possible matches as you type.
Showing results for
Not applicable
2011-05-11
09:05 AM
- Mark as New
- Bookmark
- Subscribe
- Mute
- Subscribe to RSS Feed
- Permalink
- Report Inappropriate Content
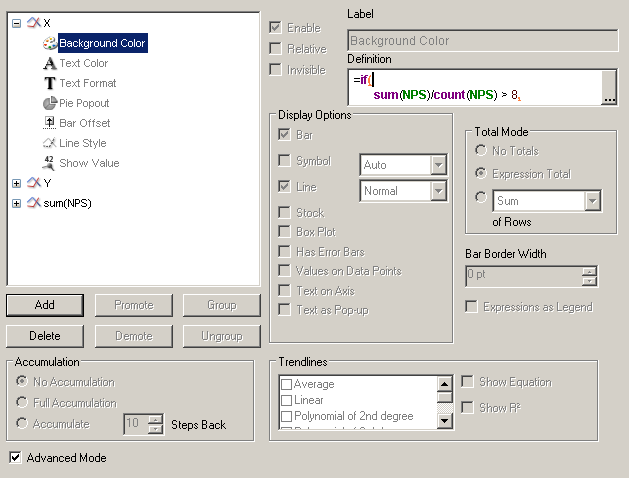
Change the chart color if...
How can I change the "circles" color of my scatter chart if the value of n expression was...
=if(sum(NPS)/count(NPS)>8) Then the color should be Green
=if(sum(NPS)/count(NPS)<6) Then the color should be Red
=if(sum(NPS)/count(NPS)>6<8) then the color should be Gray
I've tried this expression in the Backgound color of my Expression
=if(sum(NPS)/count(NPS)>8,argb(180,0,128,0),if(sum(NPS)/count(NPS)<=6,argb(180,255,0,0),argb(180,128,128,128)))
But it's not working.
So, what is going on?
Thanks for your help
7,917 Views
1 Reply
Not applicable
2011-05-11
12:09 PM
Author
- Mark as New
- Bookmark
- Subscribe
- Mute
- Subscribe to RSS Feed
- Permalink
- Report Inappropriate Content
I think it's a bug, but the color of the "circle" is not defined in the "Z" axis or in the Dimension axis, but in the "X" axis...
203 Views