Unlock a world of possibilities! Login now and discover the exclusive benefits awaiting you.
- Qlik Community
- :
- All Forums
- :
- QlikView App Dev
- :
- Change the colour of a bar based on rank of dimens...
- Subscribe to RSS Feed
- Mark Topic as New
- Mark Topic as Read
- Float this Topic for Current User
- Bookmark
- Subscribe
- Mute
- Printer Friendly Page
- Mark as New
- Bookmark
- Subscribe
- Mute
- Subscribe to RSS Feed
- Permalink
- Report Inappropriate Content
Change the colour of a bar based on rank of dimension
Hi All
I want to calculate the rank of dimension and assign colour to the dimension based on dimension rank
is it possible
- « Previous Replies
-
- 1
- 2
- Next Replies »
- Mark as New
- Bookmark
- Subscribe
- Mute
- Subscribe to RSS Feed
- Permalink
- Report Inappropriate Content
Hi,
1 example:
Dimensions / Background color
=If(Aggr(Rank(Sum(VALUE)), MONTH)<=3, LightBlue(), LightGreen())
- Mark as New
- Bookmark
- Subscribe
- Mute
- Subscribe to RSS Feed
- Permalink
- Report Inappropriate Content
Hi
this can help you:
=if(rank((Num(((sum(Feild))),'#,##0.0')))<=3,rgb(255,0,0),rgb(255,130,0))
- Mark as New
- Bookmark
- Subscribe
- Mute
- Subscribe to RSS Feed
- Permalink
- Report Inappropriate Content
Hi
Im showing top 5 values in the chart now i want different colours for different bars how can i do it
- Mark as New
- Bookmark
- Subscribe
- Mute
- Subscribe to RSS Feed
- Permalink
- Report Inappropriate Content
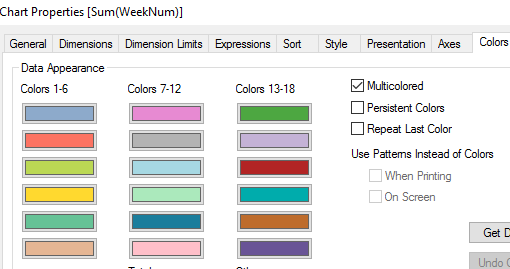
Chart-> Right click-Properties->Color tab, check 'Multicolored' to enable. If you want the colors to be persistent check 'Persistent' as well. You can choose your colors for bars from the data appearance pallet too.
- Mark as New
- Bookmark
- Subscribe
- Mute
- Subscribe to RSS Feed
- Permalink
- Report Inappropriate Content
Hi try this
=If(Aggr(Rank(Sum(VALUE)), MONTH)=1, Green(),
If(Aggr(Rank(Sum(VALUE)), MONTH)=2, Red(),
If(Aggr(Rank(Sum(VALUE)), MONTH)=3,Yellow(),
If(Aggr(Rank(Sum(VALUE)), MONTH)=4, Blue(),
If(Aggr(Rank(Sum(VALUE)), MONTH)=5, Cyan())))))
- Mark as New
- Bookmark
- Subscribe
- Mute
- Subscribe to RSS Feed
- Permalink
- Report Inappropriate Content
Hi tresesco im using two expressions and 2 dimensions in bar chart so multi coloured option is disabled
- Mark as New
- Bookmark
- Subscribe
- Mute
- Subscribe to RSS Feed
- Permalink
- Report Inappropriate Content
Hi reddy your code gives different colour for different months what i want is if china is green in colur in one month the same china should be green in colour in another month
- Mark as New
- Bookmark
- Subscribe
- Mute
- Subscribe to RSS Feed
- Permalink
- Report Inappropriate Content
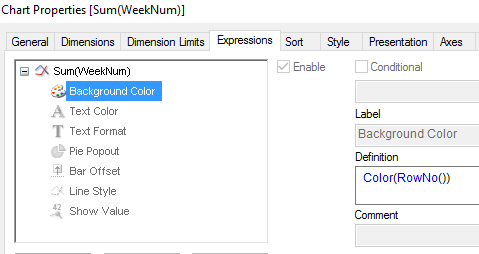
Then try background color expression : Color(RowNo()), like
- Mark as New
- Bookmark
- Subscribe
- Mute
- Subscribe to RSS Feed
- Permalink
- Report Inappropriate Content
Will this give me the below result
If in jan 2016 usa is red in colour
In feb 2016 ysa should be red
- « Previous Replies
-
- 1
- 2
- Next Replies »