Unlock a world of possibilities! Login now and discover the exclusive benefits awaiting you.
- Qlik Community
- :
- All Forums
- :
- QlikView App Dev
- :
- Re: Change the frequency of values in dimension
- Subscribe to RSS Feed
- Mark Topic as New
- Mark Topic as Read
- Float this Topic for Current User
- Bookmark
- Subscribe
- Mute
- Printer Friendly Page
- Mark as New
- Bookmark
- Subscribe
- Mute
- Subscribe to RSS Feed
- Permalink
- Report Inappropriate Content
Change the frequency of values in dimension
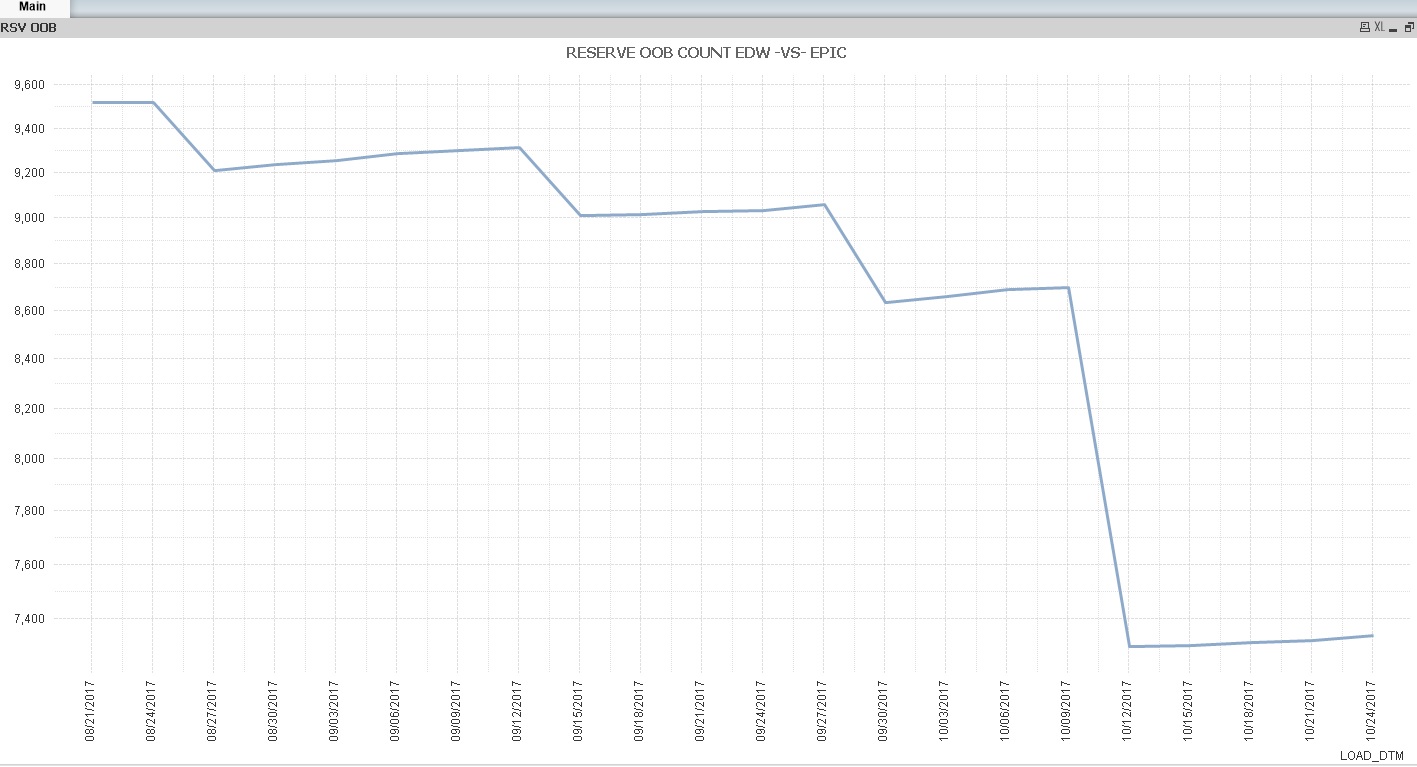
I'm plotting a line chart, where the dimension has many date values in the x-axis. Need to reduce the frequency of dimension as once in 3 days. Please advise. Thank you
- Mark as New
- Bookmark
- Subscribe
- Mute
- Subscribe to RSS Feed
- Permalink
- Report Inappropriate Content
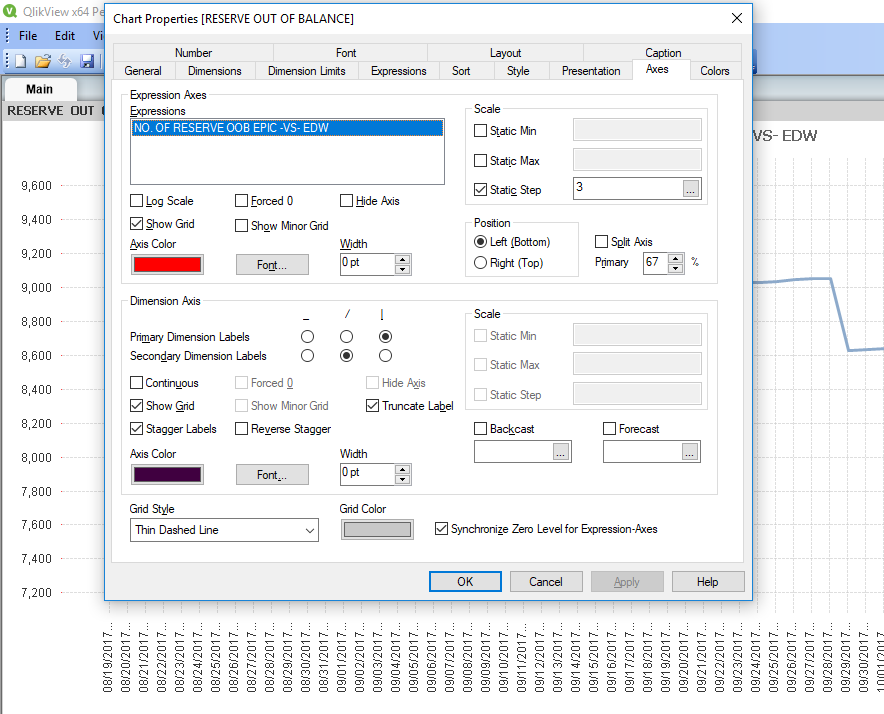
In properties > axis select a static step of 3.
- Mark as New
- Bookmark
- Subscribe
- Mute
- Subscribe to RSS Feed
- Permalink
- Report Inappropriate Content
Yeah, tried your suggestion. Still it didn't work. Below is the screen shot of the axes tab. Thanks
- Mark as New
- Bookmark
- Subscribe
- Mute
- Subscribe to RSS Feed
- Permalink
- Report Inappropriate Content
You need to do it in the lower half (dimension axis) not the upper half (expression axis).
Select Continuous. Unselect Stagger Labels.
You should then be able to enter a Static Step on the dimension.
- Mark as New
- Bookmark
- Subscribe
- Mute
- Subscribe to RSS Feed
- Permalink
- Report Inappropriate Content
Yeah, I tried your suggestion.
- Unchecked "Stagger box"
- selected Continuous box, and applied the chart vanishes in the visual area leaving a message "No numeric values on x-axis "
If i'm not wrong the x-axis contains date values which on converting to number type may work.
Attached the screen shot of chart area after selecting continuous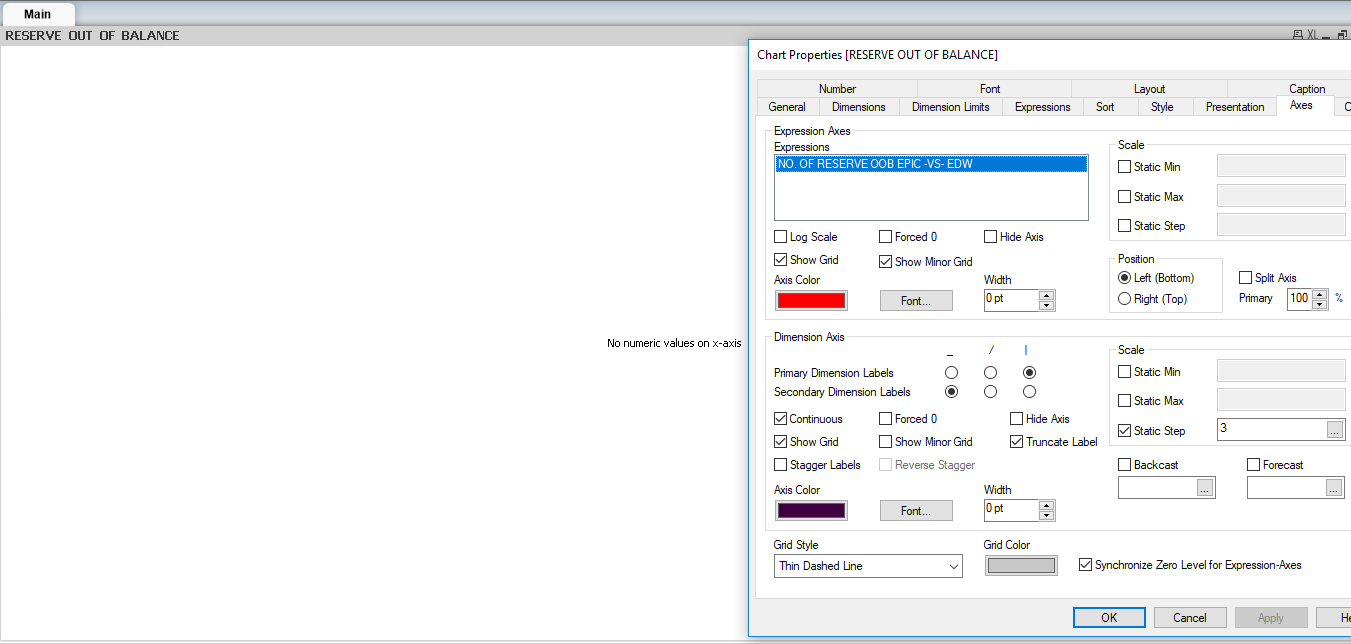 check box Please advise.
Thank you
- Mark as New
- Bookmark
- Subscribe
- Mute
- Subscribe to RSS Feed
- Permalink
- Report Inappropriate Content
Not sure. Your axis does have to be numeric.
And from here I can't tell if it is. it would seem that Qlikview doesn't think it is.
Is your field actually a date and time field? I think you may need to use a date only field.
- Mark as New
- Bookmark
- Subscribe
- Mute
- Subscribe to RSS Feed
- Permalink
- Report Inappropriate Content
Yeah, the source is from a CSV file and the column, earlier was timestamped. But after your suggestion converted it to date only column. Still it didn't work. 
- Mark as New
- Bookmark
- Subscribe
- Mute
- Subscribe to RSS Feed
- Permalink
- Report Inappropriate Content
insert sad face.
can you upload a sample file?
- Mark as New
- Bookmark
- Subscribe
- Mute
- Subscribe to RSS Feed
- Permalink
- Report Inappropriate Content
Ahhh.... I tried to reduce the x-axis interval by using MOD(DATE,3) = '0' through script and it worked now. Thanks 
- Mark as New
- Bookmark
- Subscribe
- Mute
- Subscribe to RSS Feed
- Permalink
- Report Inappropriate Content
Glad to hear it!