Unlock a world of possibilities! Login now and discover the exclusive benefits awaiting you.
- Qlik Community
- :
- All Forums
- :
- QlikView App Dev
- :
- Changing reference line dynamically (Position and ...
- Subscribe to RSS Feed
- Mark Topic as New
- Mark Topic as Read
- Float this Topic for Current User
- Bookmark
- Subscribe
- Mute
- Printer Friendly Page
- Mark as New
- Bookmark
- Subscribe
- Mute
- Subscribe to RSS Feed
- Permalink
- Report Inappropriate Content
Changing reference line dynamically (Position and Color)
Hello all,
I have 2 questions with regard to implementing a reference line for a line chart that changes dynamically.
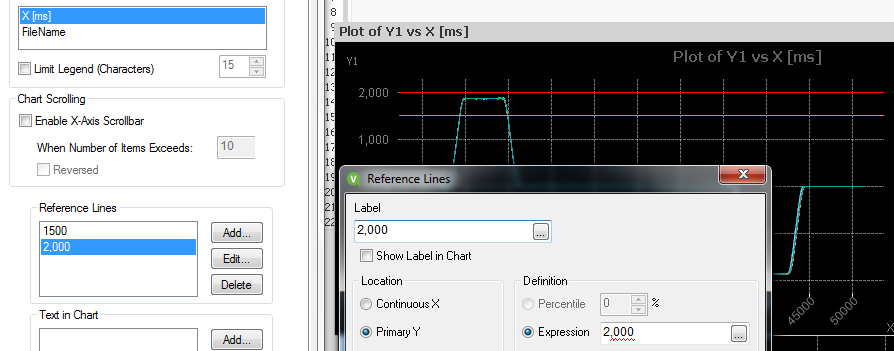
Currently, I could only create a reference value for a fixed value on the Y-axis as below:

I would like to improve upon this by:
1. Varying the reference line with regard to the dimension chosen. Currently, this plot was Y1 vs X and the reference lines were set at 1500 and 2000. If we change the dimension of the plot to Y2 vs X, the reference lines must change to 1000 and 1500.
Mock code:
If( Y1) then
Ref line 1 = 1500;
Ref line 2 = 2000;
elseif(Y2) then
Ref line 1 = 1000;
Ref line 2 = 1500;
end if
2. Changing the color of the plot values above the reference line to a particular color. For example, changing all values of Y1 above reference line 1500 to red.
Mock code:
if(Value(Y1) > 1500) then
Color of those data Points = Red;
else
No Change
End if
Any ideas with regard to implementing the above features?
Thanks in advance.
Best regards,
Suraj
Accepted Solutions
- Mark as New
- Bookmark
- Subscribe
- Mute
- Subscribe to RSS Feed
- Permalink
- Report Inappropriate Content
1. You can add a expression to the reference line, something like
=if('$(=Dim)'='Y1',1500,1000)
Where Dim is the field where you select your dimension, similar for the second reference line
2. In the background color of the plot expression (expand the + before the expression) use something like this
=if([PlotExpressionLabel]>1500,Red())
- Mark as New
- Bookmark
- Subscribe
- Mute
- Subscribe to RSS Feed
- Permalink
- Report Inappropriate Content
Hello Piet,
1. For the field used to select a dimension, Y1, Y2,etc are labels extracted from a CSV file. The below code has been used to extract the label information:

Select Field:

I'm not sure with regard to which is the field to be given for selecting the dimension. I tried giving the table name, but it wasn't correct.
Any suggestions for the same?
2. Yes, the expression worked perfectly. But, if I needed to improve upon this, say for values on the negative and positive values, what is the change in the expression that must be done?
I tried the below expression, but it was not correct:
(For all values of Y1 > 1500 or Y1 lesser than -1500, change plot color of those points to red

Current plot:

Best regards,
Suraj
- Mark as New
- Bookmark
- Subscribe
- Mute
- Subscribe to RSS Feed
- Permalink
- Report Inappropriate Content
1. I'm confused, do you use a dynamic dimension or are the Y1,Y2 values of a fixed dimension. If fixed, I don't think the reference lines change by dimension value and you would have to use 'normal' line expressions. When you use a dynamic dimension Dim is the name of the field which contains the values Y1,Y2 where an user selects the dynamic dimension, so either use Y1 or Y2 as dimension.
2. =if([PlotExpressionLabel]>1500 or [PlotExpressionLabel]<-1500 ,Red())
- Mark as New
- Bookmark
- Subscribe
- Mute
- Subscribe to RSS Feed
- Permalink
- Report Inappropriate Content
Hello Piet,
Apologies for the late reply.
1. Thanks for the clarification. In this case, Y1 and Y2 values are fixed dimension values. I have attached a delimited file showing the same. Then, what would be the best way to proceed with a line expression for this particular requirement? (Do we need to use conditional expressions in the reference line?)
2. Yes, the OR operator worked perfectly.

Regards,
Suraj
- Mark as New
- Bookmark
- Subscribe
- Mute
- Subscribe to RSS Feed
- Permalink
- Report Inappropriate Content
Hello Suraj,
I still think you use (or want to) a dynamic dimension, by which I mean variable. I have worked out a small sample (attached)based on your data. In my sample [Dim] is the field where you select your Dimension. The ref Line an expression that changes for whether you choose Y1 or another value. Is this what you mean?
- Mark as New
- Bookmark
- Subscribe
- Mute
- Subscribe to RSS Feed
- Permalink
- Report Inappropriate Content
Hello Piet,
Apologies for the late reply. Yes, your example perfectly captured what I wanted to achieve.
Thanks for the support.
Regards,
Suraj