Unlock a world of possibilities! Login now and discover the exclusive benefits awaiting you.
- Qlik Community
- :
- All Forums
- :
- QlikView App Dev
- :
- Re: Changing the color of month in a bar graph
- Subscribe to RSS Feed
- Mark Topic as New
- Mark Topic as Read
- Float this Topic for Current User
- Bookmark
- Subscribe
- Mute
- Printer Friendly Page
- Mark as New
- Bookmark
- Subscribe
- Mute
- Subscribe to RSS Feed
- Permalink
- Report Inappropriate Content
Changing the color of month in a bar graph
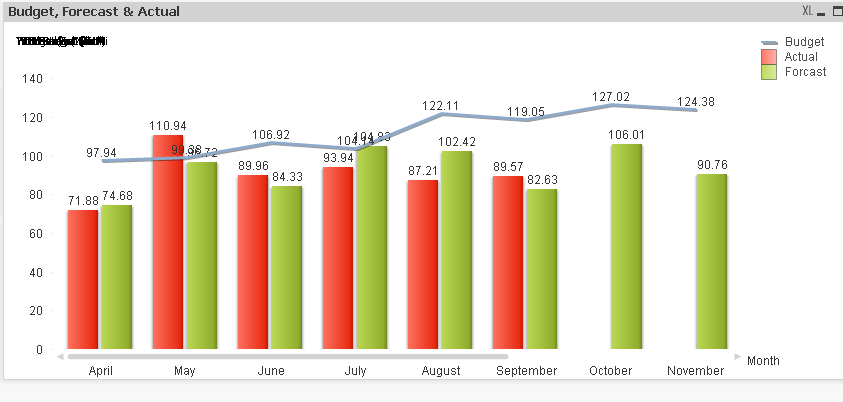
I want the months of october and november to be displayed in different colors other than green. Please can anyone help how to do that.
Thanks,
Gaurav
Accepted Solutions
- Mark as New
- Bookmark
- Subscribe
- Mute
- Subscribe to RSS Feed
- Permalink
- Report Inappropriate Content
- Mark as New
- Bookmark
- Subscribe
- Mute
- Subscribe to RSS Feed
- Permalink
- Report Inappropriate Content
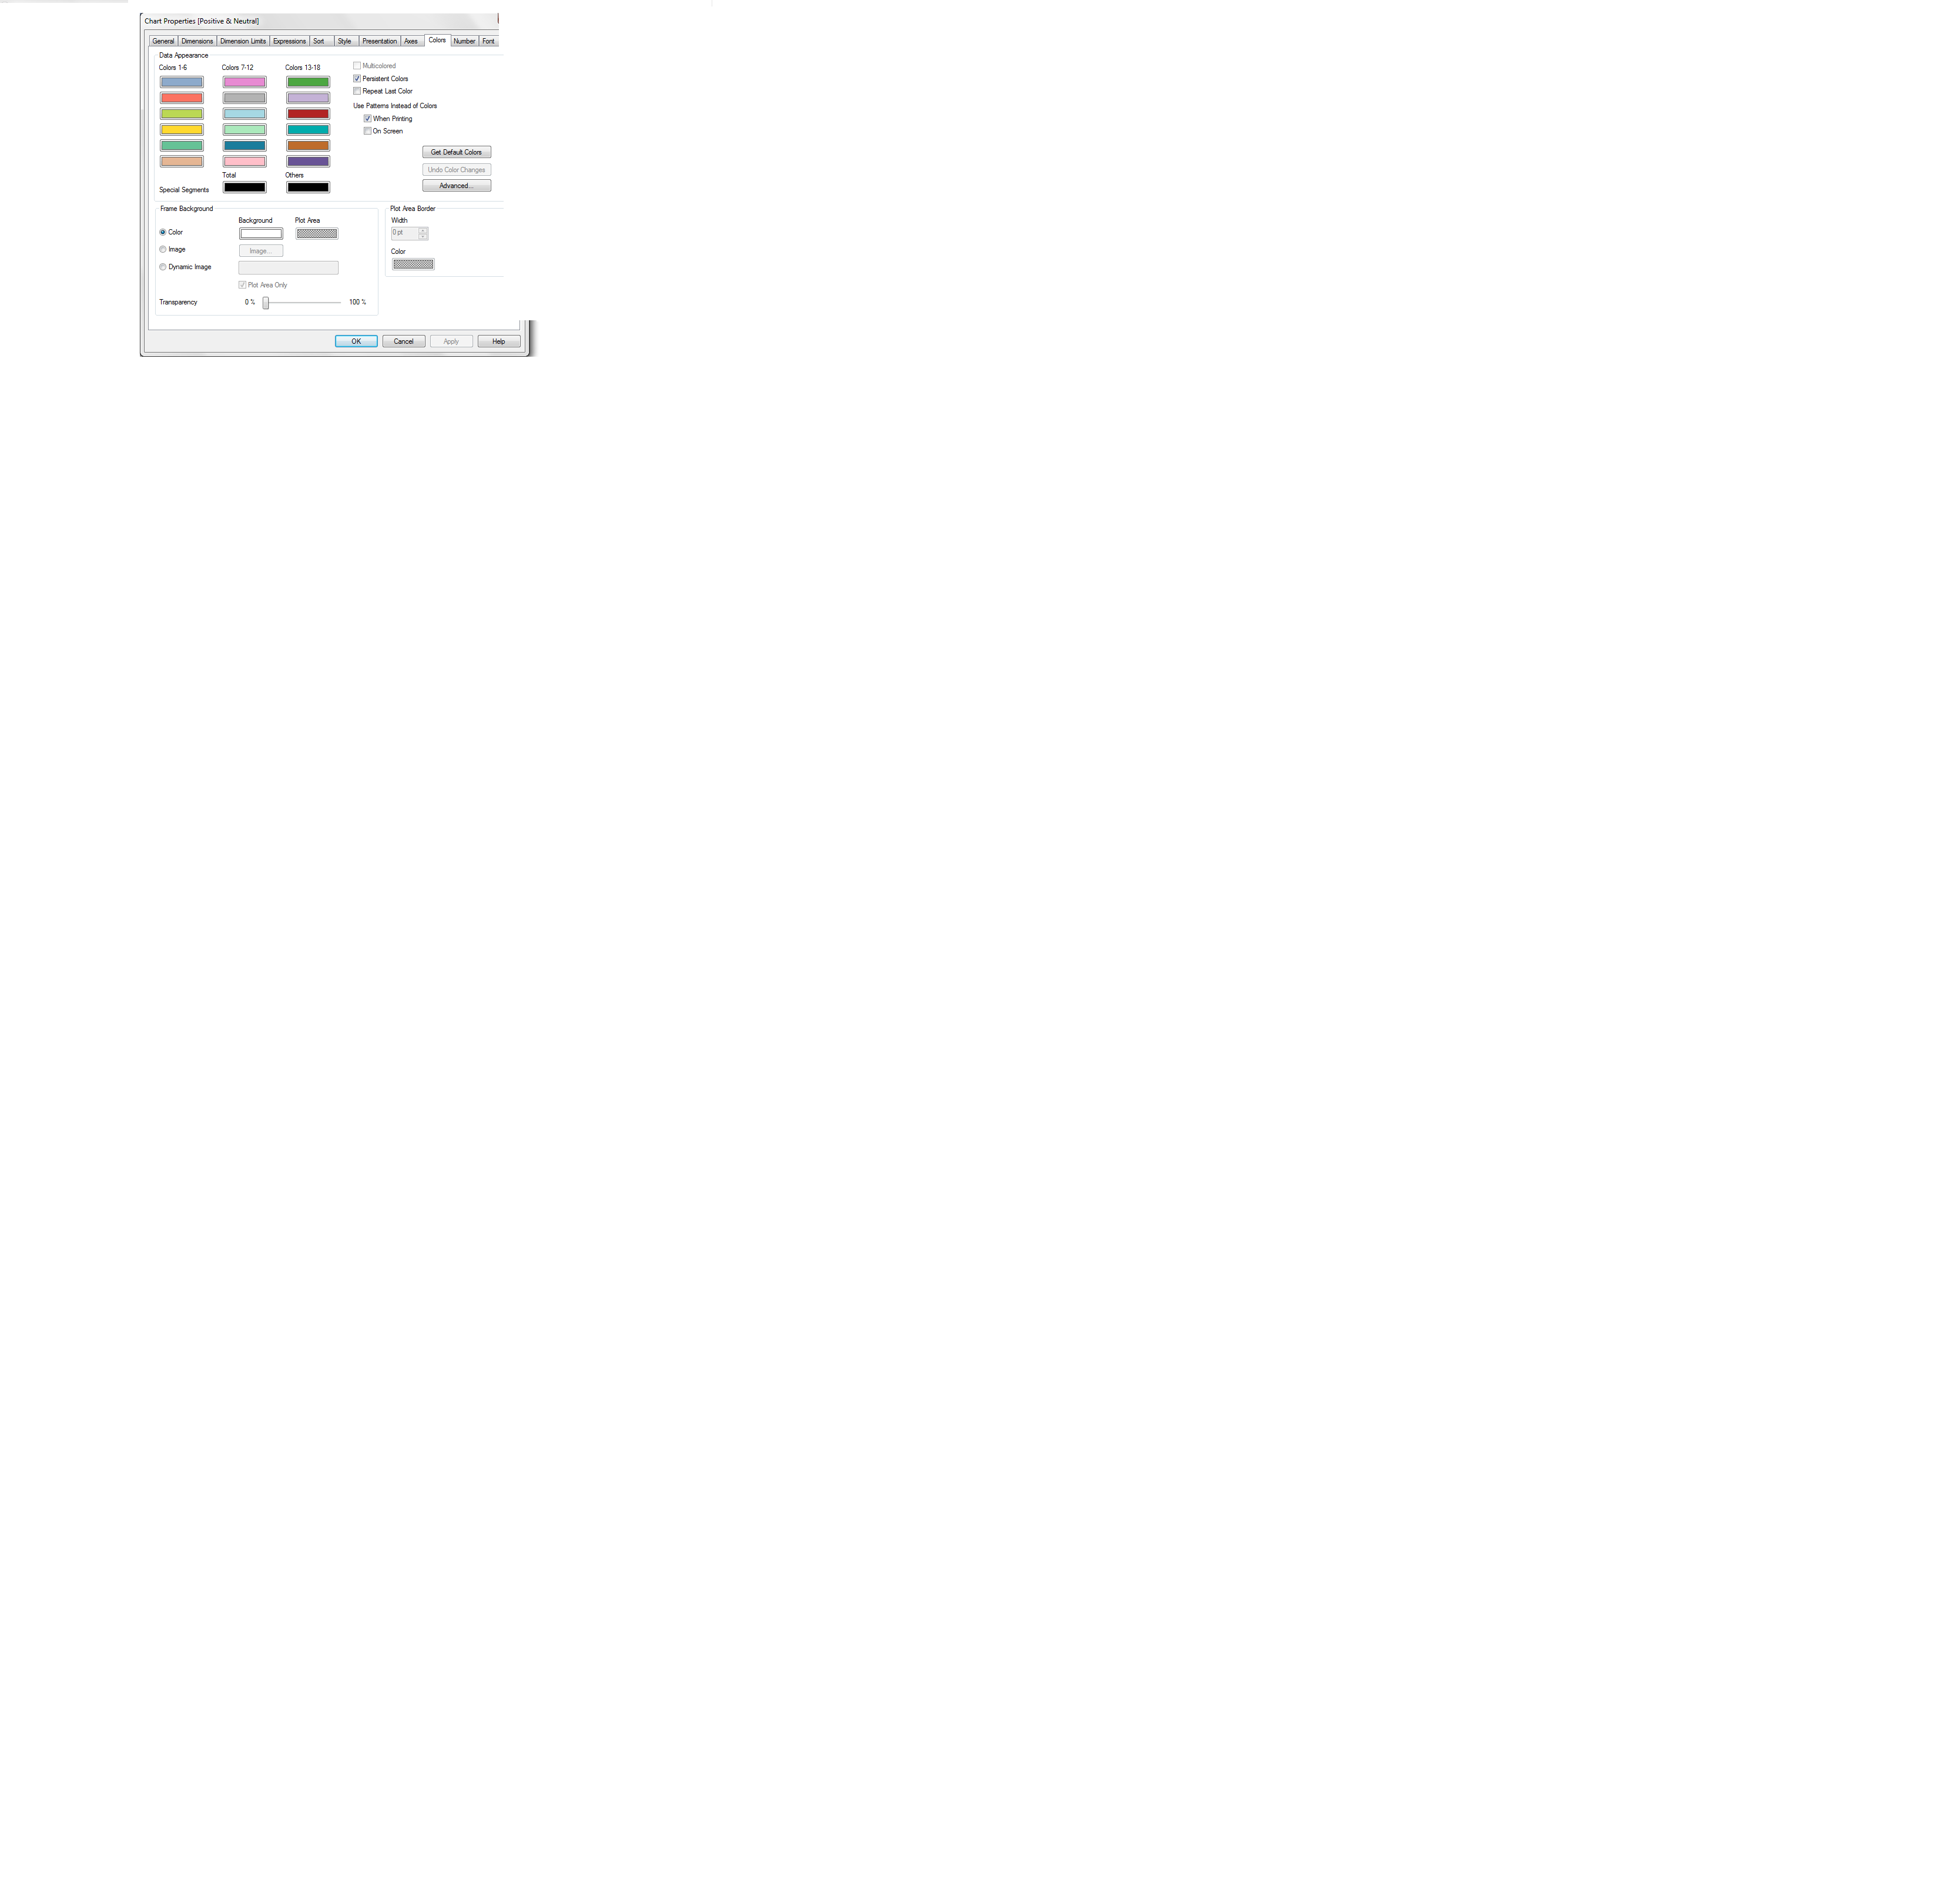
Right click --- go to properties and under colors tab you can change the colors of the bar.
- Mark as New
- Bookmark
- Subscribe
- Mute
- Subscribe to RSS Feed
- Permalink
- Report Inappropriate Content
I know, I want the expression which changes the color of forecast for the month of October and November.
The expression I figured only changes the color when I select those two months but in the default state all of them have same color.
- Mark as New
- Bookmark
- Subscribe
- Mute
- Subscribe to RSS Feed
- Permalink
- Report Inappropriate Content
Hi Gaurav,
Check attached file, hope it helps you.
Regards,
Jagan.
- Mark as New
- Bookmark
- Subscribe
- Mute
- Subscribe to RSS Feed
- Permalink
- Report Inappropriate Content
Thanks a ton bro thats what I was looking for 
- Mark as New
- Bookmark
- Subscribe
- Mute
- Subscribe to RSS Feed
- Permalink
- Report Inappropriate Content
Hi,
In Expression tab by click on plus sign in Background Color write script
if(MonthField = 'october' or MonthField = 'november' , Blue( ),Yellow( ) )
Regards,
Anand
- Mark as New
- Bookmark
- Subscribe
- Mute
- Subscribe to RSS Feed
- Permalink
- Report Inappropriate Content
I have a formula can u tell me what wrong am I doing in it
sum({1<mSeg={'Total'},mMonth={'$(=only(mMonth))'},mYear={'$(=only(mYear))'}>} mRev.)
It works if I have only two list boxes
sum({1<mSeg={'Total'},mMonth={'$(=only(mMonth))'}>} m Rev.) Working
but when I have more list boxes it dont
I want to fix the sum to one field of a list box and I want it to change w.r.t other parameters
Can u help Please.
Thanks
Gaurav Tyagi
- Mark as New
- Bookmark
- Subscribe
- Mute
- Subscribe to RSS Feed
- Permalink
- Report Inappropriate Content
Thanx bro yup I am using that formula