Unlock a world of possibilities! Login now and discover the exclusive benefits awaiting you.
- Qlik Community
- :
- All Forums
- :
- QlikView App Dev
- :
- Re: Changing the displayed format of a dimension i...
- Subscribe to RSS Feed
- Mark Topic as New
- Mark Topic as Read
- Float this Topic for Current User
- Bookmark
- Subscribe
- Mute
- Printer Friendly Page
- Mark as New
- Bookmark
- Subscribe
- Mute
- Subscribe to RSS Feed
- Permalink
- Report Inappropriate Content
Changing the displayed format of a dimension in a chart?
How do you change the displayed format of a number in a chart. Basically I am trying to change the way a number is displayed similar to how you would use the number tab to change the display of an expression. Example would be, a dimension is stored as .50, I would like to display it in the chart as 50%, or a date is stored as 40343 and I want it to be displayed as 6/14/2010.
Thanks!
Bob
Accepted Solutions
- Mark as New
- Bookmark
- Subscribe
- Mute
- Subscribe to RSS Feed
- Permalink
- Report Inappropriate Content
Try these expressions as calculated dimensions
Num(dim_data, '#,##0%')
Date(date_data, 'MM/DD/YYYY')
- Mark as New
- Bookmark
- Subscribe
- Mute
- Subscribe to RSS Feed
- Permalink
- Report Inappropriate Content
See tab Number on the Document Properties.
The only note - it is applicable to the whole document, not just one chart. But this is what you typically need for dimensions.
Regards,
Michael
Edit: In an unlikely case you want it different for the specific chart, you can use calculated dimension and specify format explicitly.
- Mark as New
- Bookmark
- Subscribe
- Mute
- Subscribe to RSS Feed
- Permalink
- Report Inappropriate Content
Try these expressions as calculated dimensions
Num(dim_data, '#,##0%')
Date(date_data, 'MM/DD/YYYY')
- Mark as New
- Bookmark
- Subscribe
- Mute
- Subscribe to RSS Feed
- Permalink
- Report Inappropriate Content
To format numbers, use num(YourNumberField, 'Some format here'). For dates, date(YourDateField, 'Some format here').
If you're not familiar with the formats, you can easily figure them out by looking on the numbers tab, figuring out the format you want, then copying the format into your expression.
For example, for your percentage:
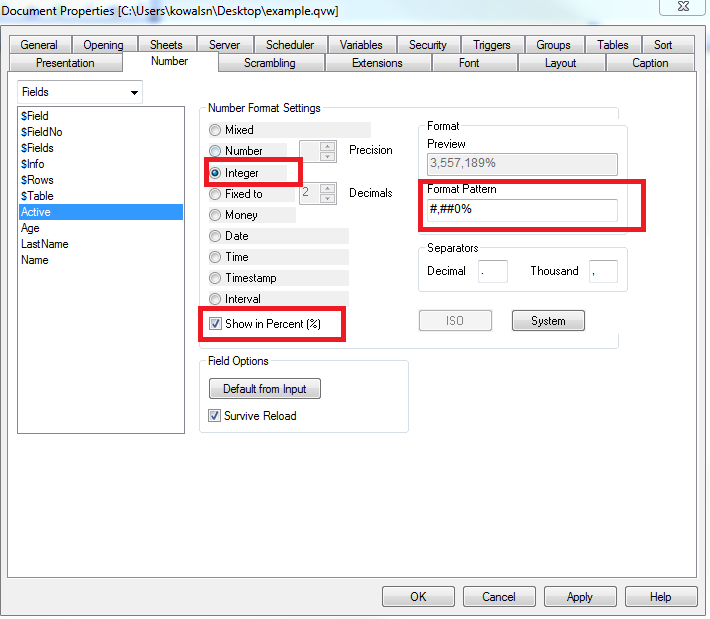
So I know to use num(YourNumberField, '#,##0%').
Once you do this over and over, you'll start to learn what the formats are.
Good luck!
- Mark as New
- Bookmark
- Subscribe
- Mute
- Subscribe to RSS Feed
- Permalink
- Report Inappropriate Content
Oddly enough when you add a value to the Static Step in the Axes tab, the Axes will pick up the format selected in the Numbers tab. Read this somewhere on this community and tried it and it worked.
for the date format, assuming it is a dimension in your chart:
These two will change it across the entire document:
In the load script when creating the dimension, format the date
In the Settings > Document Properties > Number
To change it just in the one chart use the calculated dimension and format it there or the text format properties for that dimension.
- Mark as New
- Bookmark
- Subscribe
- Mute
- Subscribe to RSS Feed
- Permalink
- Report Inappropriate Content
QlikCommunity is awesome! Thank you all for your responses! I was able to change the displayed format using your suggestions.
Have a great day!
Bob
- Mark as New
- Bookmark
- Subscribe
- Mute
- Subscribe to RSS Feed
- Permalink
- Report Inappropriate Content
Thanks Michael for this solution!
I was using a calculated dimension with a num function to specify format, but it was killing the performance of the table.
Roz
- Mark as New
- Bookmark
- Subscribe
- Mute
- Subscribe to RSS Feed
- Permalink
- Report Inappropriate Content
I've been trying the same thing. However, for some reason, when i use the "Num" function in a dimension, i get null values in that column.
Anyone got an idea what could cause that?