Unlock a world of possibilities! Login now and discover the exclusive benefits awaiting you.
- Qlik Community
- :
- All Forums
- :
- QlikView App Dev
- :
- Re: Chart Display?
- Subscribe to RSS Feed
- Mark Topic as New
- Mark Topic as Read
- Float this Topic for Current User
- Bookmark
- Subscribe
- Mute
- Printer Friendly Page
- Mark as New
- Bookmark
- Subscribe
- Mute
- Subscribe to RSS Feed
- Permalink
- Report Inappropriate Content
Chart Display?
Hi All,
I have two queries with my chart I am trying to create.
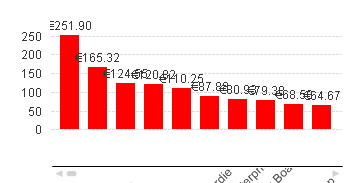
1) Why is there a gap between the x-axis and where the bar chart starts? And how do I fix this?
2) Is there a way I can turn off the data point when no selections have been made and then when I make a selection the data points will show ?
Thanks in advance.
Stephen
- « Previous Replies
-
- 1
- 2
- Next Replies »
- Mark as New
- Bookmark
- Subscribe
- Mute
- Subscribe to RSS Feed
- Permalink
- Report Inappropriate Content
Hey Alan,
Hows things? Thanks for the reply. Wasnt expecting the 9 or so in such a quick response. I'm going to take a look at your Alternative states youtube vid to sort the selection choice.
I had negative values at the end of the axis so boxed off that first query!
Speak soon,
Stephen
- Mark as New
- Bookmark
- Subscribe
- Mute
- Subscribe to RSS Feed
- Permalink
- Report Inappropriate Content
Ok,
good luck, are HSBC using QV, or you using it yourself?
- « Previous Replies
-
- 1
- 2
- Next Replies »