Unlock a world of possibilities! Login now and discover the exclusive benefits awaiting you.
- Qlik Community
- :
- All Forums
- :
- QlikView App Dev
- :
- Re: Chart Expression Assistance
- Subscribe to RSS Feed
- Mark Topic as New
- Mark Topic as Read
- Float this Topic for Current User
- Bookmark
- Subscribe
- Mute
- Printer Friendly Page
- Mark as New
- Bookmark
- Subscribe
- Mute
- Subscribe to RSS Feed
- Permalink
- Report Inappropriate Content
Chart Expression Assistance
Hello!
I'm stuck on an expression for a chart I'm putting together.
Data is laid out as per the table below. This is a very small subset.
| PKT_CTRL_NBR | DIV | CHANNEL | CREATE_DATE | PRINT_DATE | UNITS |
| 8370650 | WHOLESALE | WHOLESALE | 12/14/2015 | 01/13/2016 | 13 |
| 8370651 | WHOLESALE | WHOLESALE | 12/15/2015 | 01/06/2016 | 26 |
| 8370652 | WHOLESALE | WHOLESALE | 12/29/2015 | 01/04/2016 | 6581 |
| 8370653 | RETAIL | DOS | 12/29/2015 | 01/04/2016 | 4546 |
| 8370654 | WHOLESALE | WHOLESALE | 12/30/2015 | 01/04/2016 | 2167 |
| 8370655 | RETAIL | DOS | 12/30/2015 | 01/04/2016 | 2167 |
| 8370656 | WHOLESALE | WHOLESALE | 12/30/2015 | 01/05/2016 | 264 |
| 8370657 | RETAIL | DOS | 12/30/2015 | 01/08/2016 | 1996 |
| 8370658 | WHOLESALE | WHOLESALE | 12/31/2015 | 01/04/2016 | 1000 |
| 8370659 | RETAIL | DOS | 12/31/2015 | 01/04/2016 | 891 |
| 8370660 | WHOLESALE | WHOLESALE | 12/31/2015 | 01/08/2016 | 100 |
| 8370661 | RETAIL | DOS | 12/31/2015 | 01/08/2016 | 236 |
| 8370662 | WHOLESALE | WHOLESALE | 12/31/2015 | 01/12/2016 | 576 |
| 8370663 | RETAIL | DOS | 12/31/2015 | 01/13/2016 | 100 |
| 8370664 | WHOLESALE | WHOLESALE | 12/31/2015 | 01/13/2016 | 194 |
| 8370665 | WHOLESALE | WHOLESALE | 01/01/2016 | 01/04/2016 | 101 |
| 8370666 | WHOLESALE | WHOLESALE | 01/03/2016 | 01/04/2016 | 500 |
| 8370667 | RETAIL | DOS | 01/03/2016 | 01/04/2016 | 768 |
| 8370668 | WHOLESALE | WHOLESALE | 01/03/2016 | 01/05/2016 | 500 |
| 8370669 | RETAIL | DOS | 01/03/2016 | 01/05/2016 | 526 |
| 8370670 | WHOLESALE | WHOLESALE | 01/03/2016 | 01/06/2016 | 200 |
| 8370671 | RETAIL | DOS | 01/03/2016 | 01/06/2016 | 298 |
| 8370672 | WHOLESALE | WHOLESALE | 01/04/2016 | 01/04/2016 | 192 |
| 8370673 | RETAIL | DOS | 01/04/2016 | 01/05/2016 | 8426 |
| 8370674 | WHOLESALE | WHOLESALE | 01/04/2016 | 01/06/2016 | 1107 |
| 8370675 | RETAIL | DOS | 01/04/2016 | 01/13/2016 | 124 |
| 8370676 | WHOLESALE | WHOLESALE | 01/04/2016 | 01/20/2016 | 94 |
| 8370677 | RETAIL | DOS | 01/04/2016 | 01/26/2016 | 81 |
What I'm trying to show is how many UNITS were available to print each day.
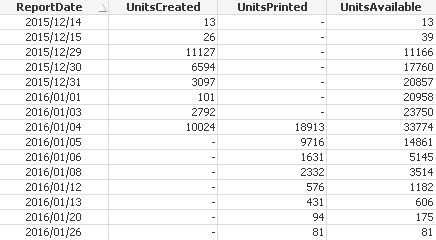
What I'd like to see is something like this:
| PRINT_DATE | UNITS_CREATED | UNITS_PRINTED | UNITS_AVAILABLE |
| 01/04/2016 | 10024 | 18913 | 33774 |
Then the pattern would repeat for each day. The units available would be the total of units printed that day and units created but not yet printed. Is this even possible? Any help would be fantastic.
- « Previous Replies
-
- 1
- 2
- Next Replies »
- Mark as New
- Bookmark
- Subscribe
- Mute
- Subscribe to RSS Feed
- Permalink
- Report Inappropriate Content
So units available also considers units that have been created before that date?
- Mark as New
- Bookmark
- Subscribe
- Mute
- Subscribe to RSS Feed
- Permalink
- Report Inappropriate Content
Hi,
What is your logic for UNITS Created, UNITS_PRINTED, UNITED PRINTED can you brief out.
If possible give your data in an excel or comma separated so that it will easy for us to load.
- Mark as New
- Bookmark
- Subscribe
- Mute
- Subscribe to RSS Feed
- Permalink
- Report Inappropriate Content
Assuming the data is loaded as per your post into table "Data1", then load like this:
Data2:
NoConcatenate
LOAD CREATE_DATE as ReportDate,
    Sum(UNITS) as UnitsCreated
Resident Data1
Group By CREATE_DATE;

Join(Data2)
LOAD PRINT_DATE as ReportDate,
    Sum(UNITS) as UnitsPrinted
Resident Data1
Group By PRINT_DATE;

Join(Data2)
LOAD ReportDate,
    RangeSum(UnitsCreated, -Previous(UnitsPrinted), Peek(UnitsAvailable)) as UnitsAvailable
Resident Data2
Order by ReportDate;
Then create a table with ReportDate as dimension and Sum(UnitsCreated), Sum(UnitsPrinted), Sum(UnitsAvailable) as expressions:
EDIT - fixed missing '-' sign....
- Mark as New
- Bookmark
- Subscribe
- Mute
- Subscribe to RSS Feed
- Permalink
- Report Inappropriate Content
Hi Jonathan,
Could you please elaborate
RangeSum(UnitsCreated, -Previous(UnitsPrinted), Peek(UnitsAvailable)) as UnitsAvailable
The above line especially -Previous(UnitsPrinted)
- Mark as New
- Bookmark
- Subscribe
- Mute
- Subscribe to RSS Feed
- Permalink
- Report Inappropriate Content
Correct.
If the Print Date is 1/4. The available total should include everything Created on 1/4 or before that has not yet been Printed.
- Mark as New
- Bookmark
- Subscribe
- Mute
- Subscribe to RSS Feed
- Permalink
- Report Inappropriate Content
Hello,
The Create Date for a unit is the date it is transferred from SAP into my warehouse system.
The Print Date is the day the warehouse begins processing the units.
I've attached a larger set of data in a .txt file.
Thanks,
Kevin
- Mark as New
- Bookmark
- Subscribe
- Mute
- Subscribe to RSS Feed
- Permalink
- Report Inappropriate Content
Here's what the data looks like in a Pivot Chart. Print Date is across the top.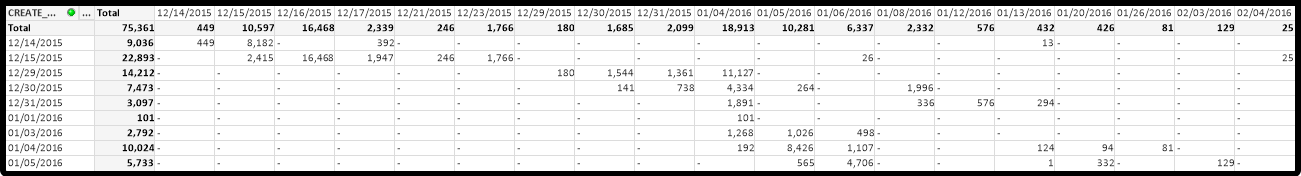
- Mark as New
- Bookmark
- Subscribe
- Mute
- Subscribe to RSS Feed
- Permalink
- Report Inappropriate Content
Hello,
Thanks for this sample. I loaded the csv file sample I uploaded above and the numbers work.
How would you load the keeping the other fields?
- Mark as New
- Bookmark
- Subscribe
- Mute
- Subscribe to RSS Feed
- Permalink
- Report Inappropriate Content
Hi ,
You can also use something like this
Script :
avail:
LOAD PKT_CTRL_NBR,
DIV,
CHANNEL,
'C' as Flag,
CREATE_DATE as Date,
UNITS
FROM
available_test.csv
(txt, utf8, embedded labels, delimiter is ',', msq, no eof);
LOAD PKT_CTRL_NBR,
DIV,
CHANNEL,
'P' as Flag,
PRINT_DATE as Date,
UNITS
FROM
available_test.csv
(txt, utf8, embedded labels, delimiter is ',', msq, no eof);
;

Created : sum({<Flag={'C'}>}UNITS)
Printed: sum({<Flag={'P'}>}UNITS)
Available: sum({<Date={"<=$(=date(only(Date)))"},Flag={'C'}>}UNITS)
- « Previous Replies
-
- 1
- 2
- Next Replies »