Unlock a world of possibilities! Login now and discover the exclusive benefits awaiting you.
- Qlik Community
- :
- All Forums
- :
- QlikView App Dev
- :
- Chart Help
- Subscribe to RSS Feed
- Mark Topic as New
- Mark Topic as Read
- Float this Topic for Current User
- Bookmark
- Subscribe
- Mute
- Printer Friendly Page
- Mark as New
- Bookmark
- Subscribe
- Mute
- Subscribe to RSS Feed
- Permalink
- Report Inappropriate Content
Chart Help
Hello-
I have a chart (posted below) that measures timeOUT as the Dimension and =CurrentTotal as the expression

What I want to be able to do is only show the red line (which is predictive) when the blue line (which is actual sales) ends, or after the max timeOUT.
Can anyone tell me how this would be able to be done?
- « Previous Replies
-
- 1
- 2
- Next Replies »
- Mark as New
- Bookmark
- Subscribe
- Mute
- Subscribe to RSS Feed
- Permalink
- Report Inappropriate Content
Is the red line built using an expression?
- Mark as New
- Bookmark
- Subscribe
- Mute
- Subscribe to RSS Feed
- Permalink
- Report Inappropriate Content
Yes, the expression is using two variables:
vPredictiveM =LINEST_M(CurrentTotal, timeOUT)
vPredictiveB =Max(CurrentTotal)-(Linest_M(CurrentTotal, timeOUT)*Max(timeOUT))
And the line expression is:
only({1}$(=vPredictiveM)*timeOUT)+$(=vPredictiveB)
- Mark as New
- Bookmark
- Subscribe
- Mute
- Subscribe to RSS Feed
- Permalink
- Report Inappropriate Content
May be you need to do this
If(Column(1) = 0, Only({1}$(=vPredictiveM)*timeOUT)+$(=vPredictiveB))
Here I am assuming that Blue line is your 1st expression and Red line is your second expression
- Mark as New
- Bookmark
- Subscribe
- Mute
- Subscribe to RSS Feed
- Permalink
- Report Inappropriate Content
the blue line is my first line and the red line isnt 2nd, however when I do the above recommendation the red line disappears.
- Mark as New
- Bookmark
- Subscribe
- Mute
- Subscribe to RSS Feed
- Permalink
- Report Inappropriate Content
How about this:
If(Column(1) > 0, Null(), Only({1}$(=vPredictiveM)*timeOUT)+$(=vPredictiveB))
Would you be able to share a sample if this still doesn't work?
- Mark as New
- Bookmark
- Subscribe
- Mute
- Subscribe to RSS Feed
- Permalink
- Report Inappropriate Content
Unfortunately i can't share a sample, however is there just a way to do this in the line shading? Like the background color or line style?
- Mark as New
- Bookmark
- Subscribe
- Mute
- Subscribe to RSS Feed
- Permalink
- Report Inappropriate Content
I guess it will run into similar issues... but I would try something like this in background color for the red line
If(Column(1) = 0, White(), LightRed())
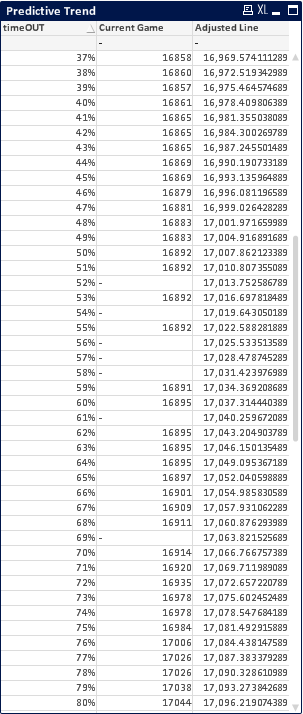
Now this will again run into the same issues where it is unable to detect Column(1) value. Can you convert your chart into a straight table and share a screenshot?
- Mark as New
- Bookmark
- Subscribe
- Mute
- Subscribe to RSS Feed
- Permalink
- Report Inappropriate Content
- Mark as New
- Bookmark
- Subscribe
- Mute
- Subscribe to RSS Feed
- Permalink
- Report Inappropriate Content
Try this
If(Len(Trim([Current Game])) = 0, Only({1}$(=vPredictiveM)*timeOUT)+$(=vPredictiveB))
or for background color expression
If(Len(Trim([Current Game])) = 0, LightRed(), White())
- « Previous Replies
-
- 1
- 2
- Next Replies »